Once you log in to Rave, you’ll land on the homepage/dashboard. You can return to it at any time by selecting the Home icon.
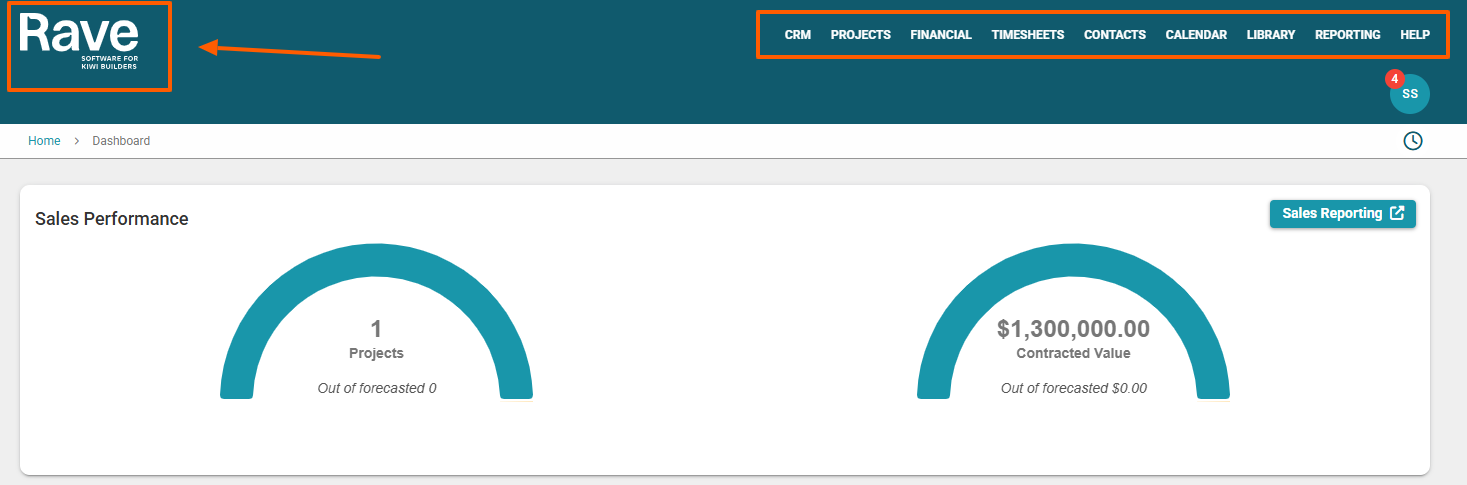
The main navigation buttons are available at the top of the screen, allowing you to move between different areas of Rave.
Main navigation
Home – Returns you to the homepage/dashboard.
CRM – Access your CRM tools to manage clients and enquiries, update sales pipeline stages, and record follow-up activities. Depending on your access, you may also have the Sales Pipeline view.
Projects – Create and manage projects, access project information, and view related client and enquiry details. This option is available to users with access to the Projects module.
Financial – Access financial tools for proposals, quote requests, quotes, purchase orders, bills, invoicing and financial reporting. This option is available to users with access to the Financial module.
Contractors/Contacts – Add and manage contractors, suppliers and other contacts.
Calendar – View and manage scheduled activities, appointments and tasks.
Reporting – Access reports at salesperson, branch or company level, depending on your permissions.
Help – Access Rave support resources, tutorials and help articles, and submit support requests or development suggestions.
Your Profile menu
Select your profile icon to access Notifications, Mail and Profile Settings. The Notifications option displays a red indicator showing the number of new notifications.
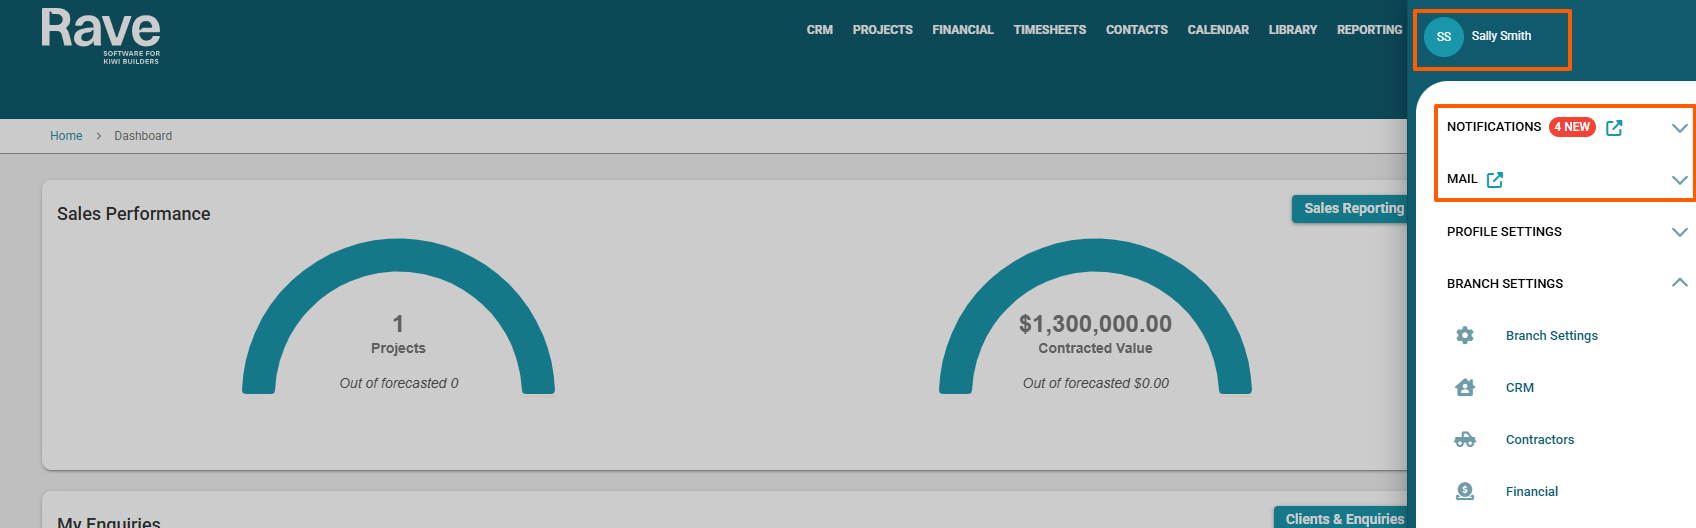
Your dashboard provides quick access to the information and tools relevant to your role. The sections displayed depend on your permissions and the features enabled for your branch.
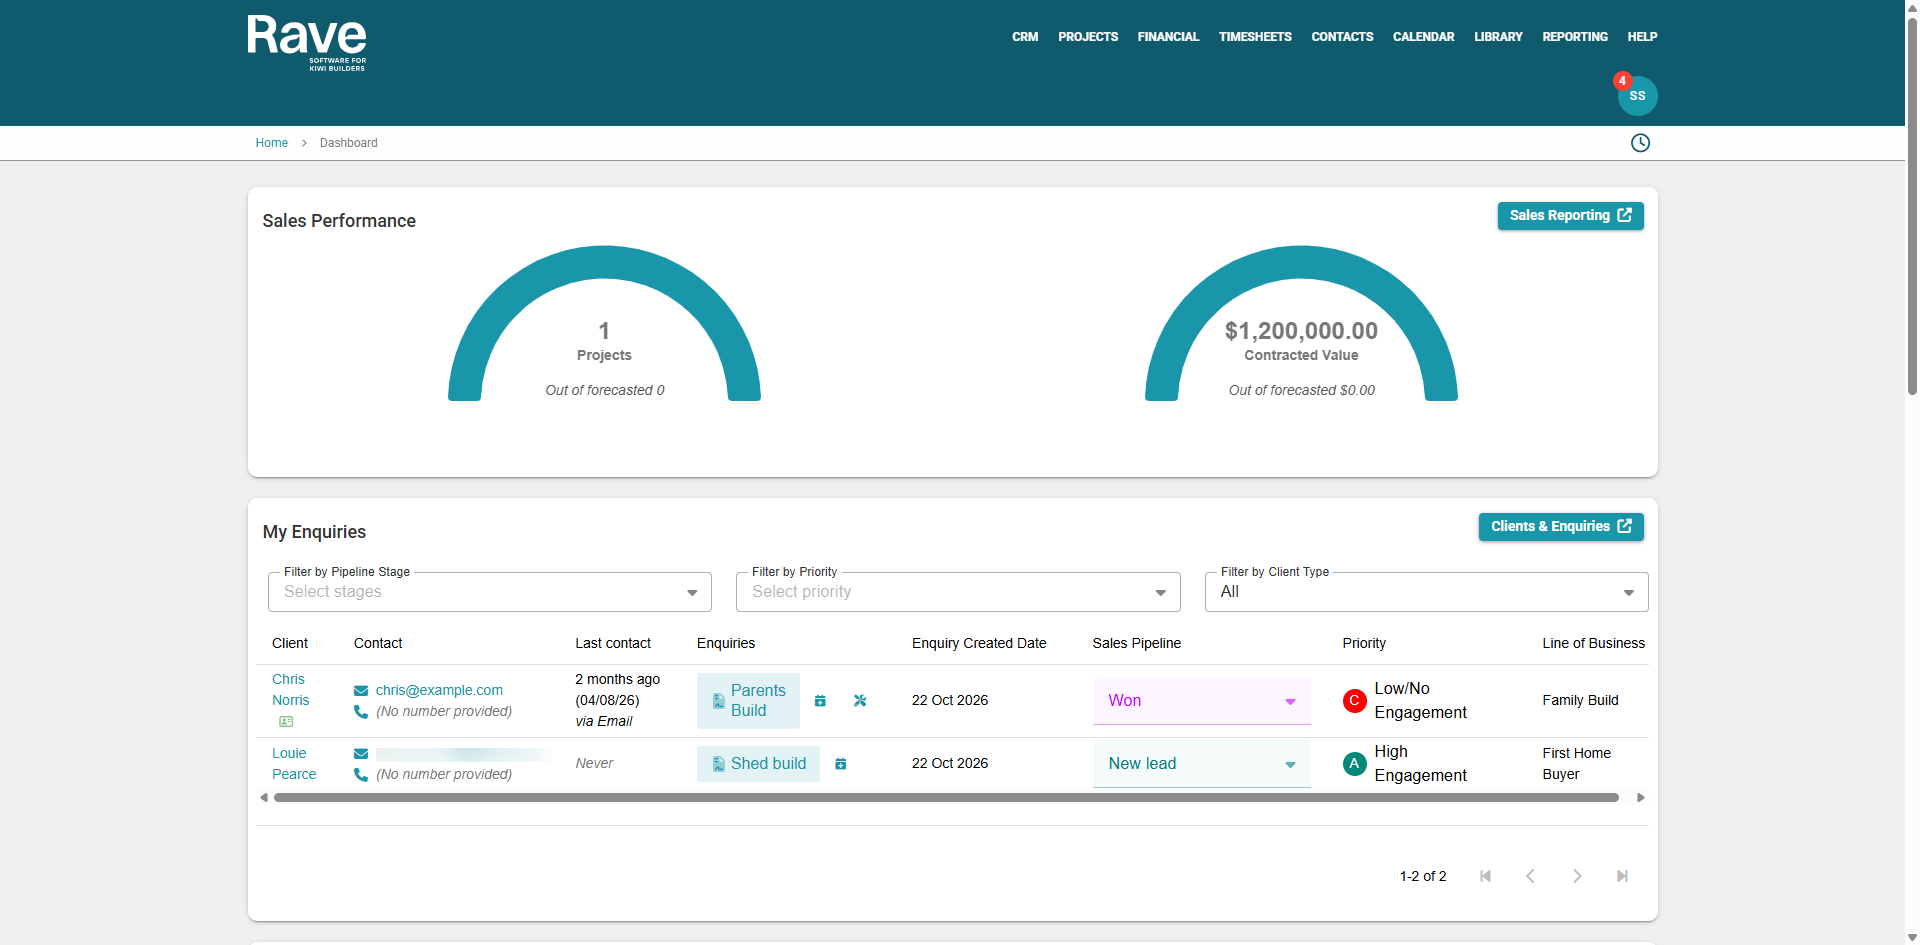
Salesperson Dashboard
Salespeople with a custom sales forecast can use the Sales Performance dashboard to compare their expected sales targets against actual results.
The dashboard includes two speedometer graphs:
Projects – Shows the number of projects secured against the forecast.
Contracted Value – Shows the value of signed contracts against the forecast.
The graphs use the following colours:
Teal – Shows the projects and signed contract value secured so far.
Grey – Shows the remaining amount when results are below the forecast.
Gold – Indicates that the forecast has been exceeded.
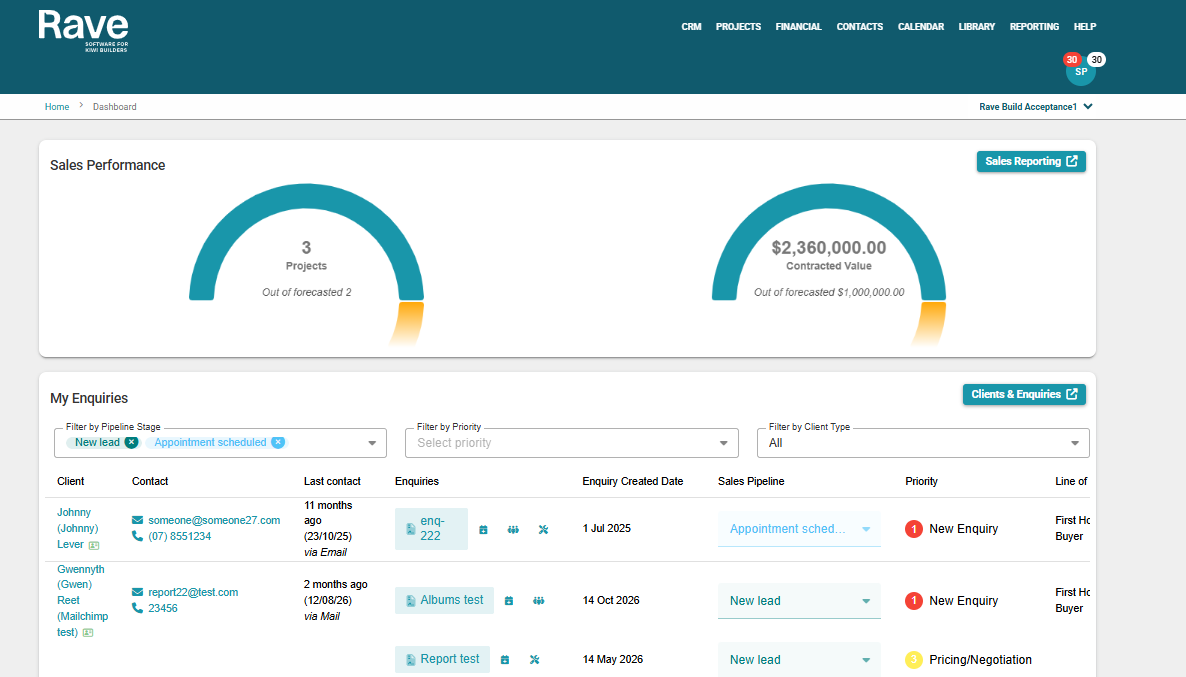
Salespeople can also access their My Enquiries list, use the available filters and select Leads & Clients to open the CRM Clients & Enquiries screen.
For more information about managing clients and enquiries, see Rave’s CRM Leads & Clients Tab Overview.
The dashboard varies depending on your role and permissions. Branch Owners and Project Managers with sales permissions can see Sales Performance, My Enquiries and Active Projects. Users without sales access may only see Active Projects. Timesheet and Site Staff users see Scheduled Tasks rather than sales or higher-level project information.
Your Salesperson Reports
Salespeople can access their reports by selecting Sales Reporting from the dashboard.
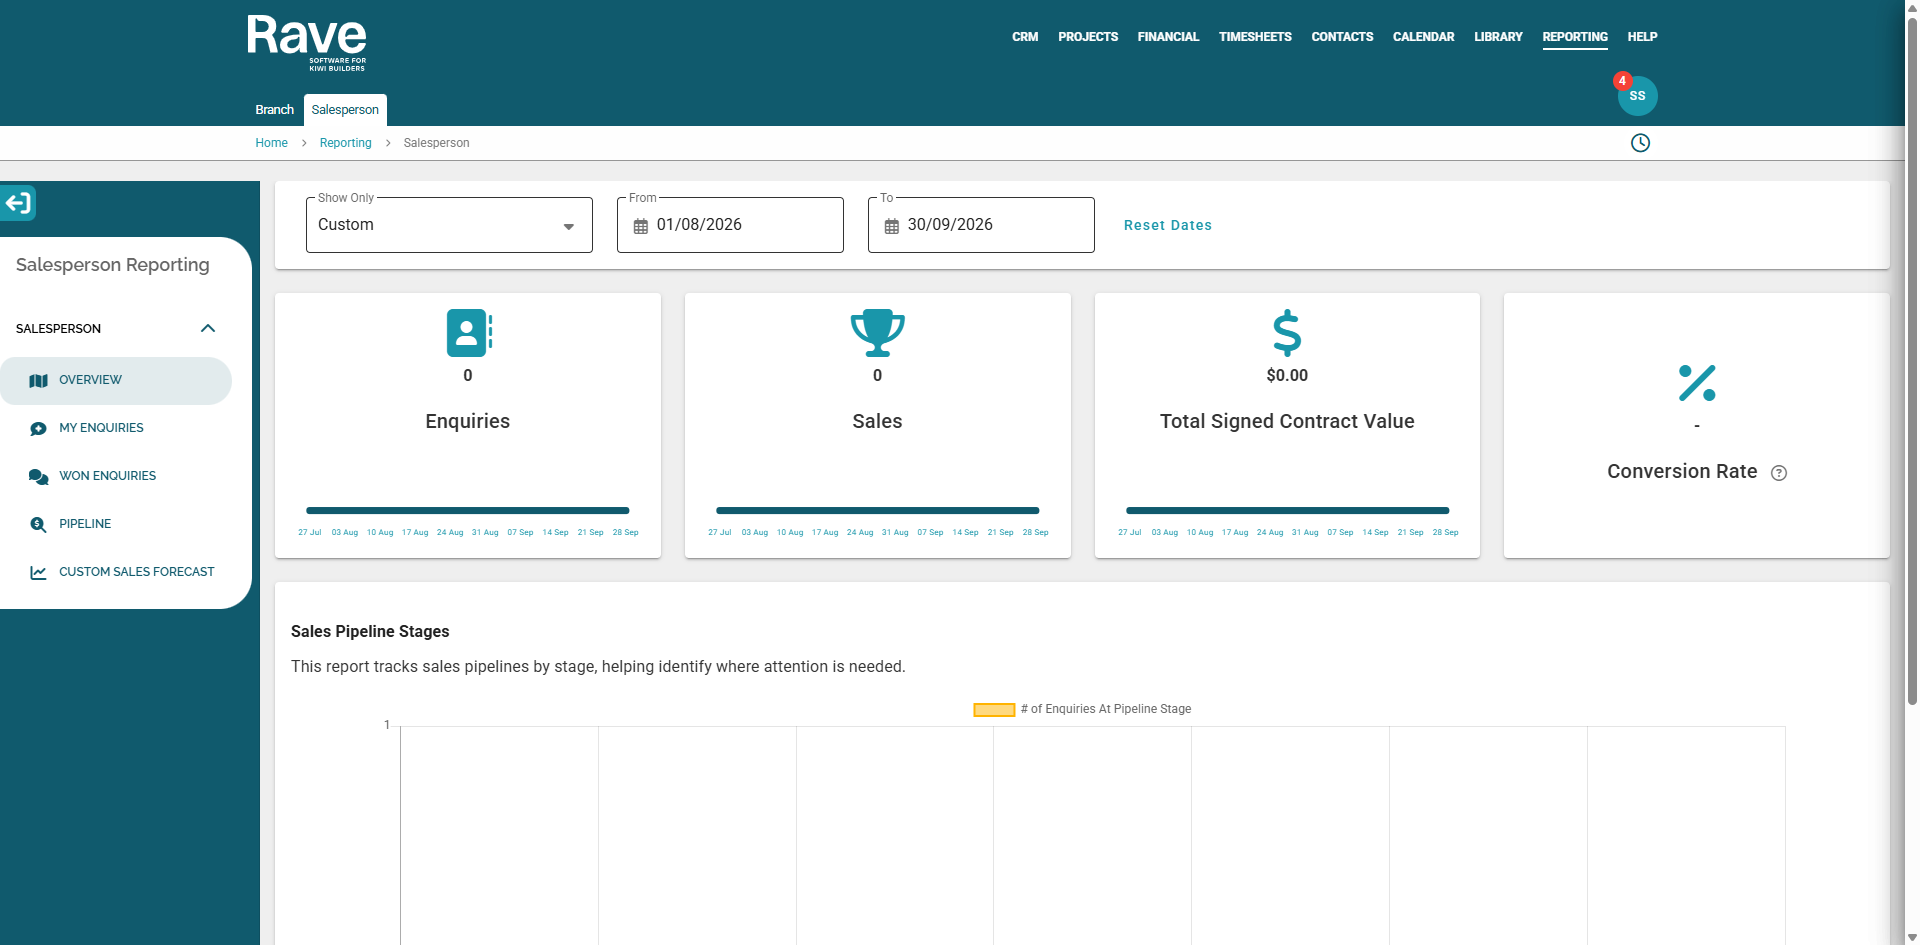
From the dashboard, select Sales Reporting to access the available reports, including Overview, My Enquiries, Won Enquiries, Pipeline and Custom Sales Forecast.
For more information, see Salesperson Reports.
Was this article helpful?
That’s Great!
Thank you for your feedback
Sorry! We couldn't be helpful
Thank you for your feedback
Feedback sent
We appreciate your effort and will try to fix the article