Accessing the Reporting Module
To begin:
Click on ‘Reporting’ at the top-right of your Rave screen.
Depending on your permission level, you will see tabs for:
Company
Branch
Salesperson
For this guide, we are focusing on the Branch tab.
Navigating to CRM Reports
In the Reporting Module, click on the CRM tab (left-hand side).
You will now see a list of available CRM reports.
The Custom Sales Forecast report is the one you need for this guide.
The Custom Sales Forecast Report pulls data from entries you have created in the new CRM Settings area called Custom Sales Forecast. To learn how to set up and manage these custom forecasts, refer to the Guide linked here.
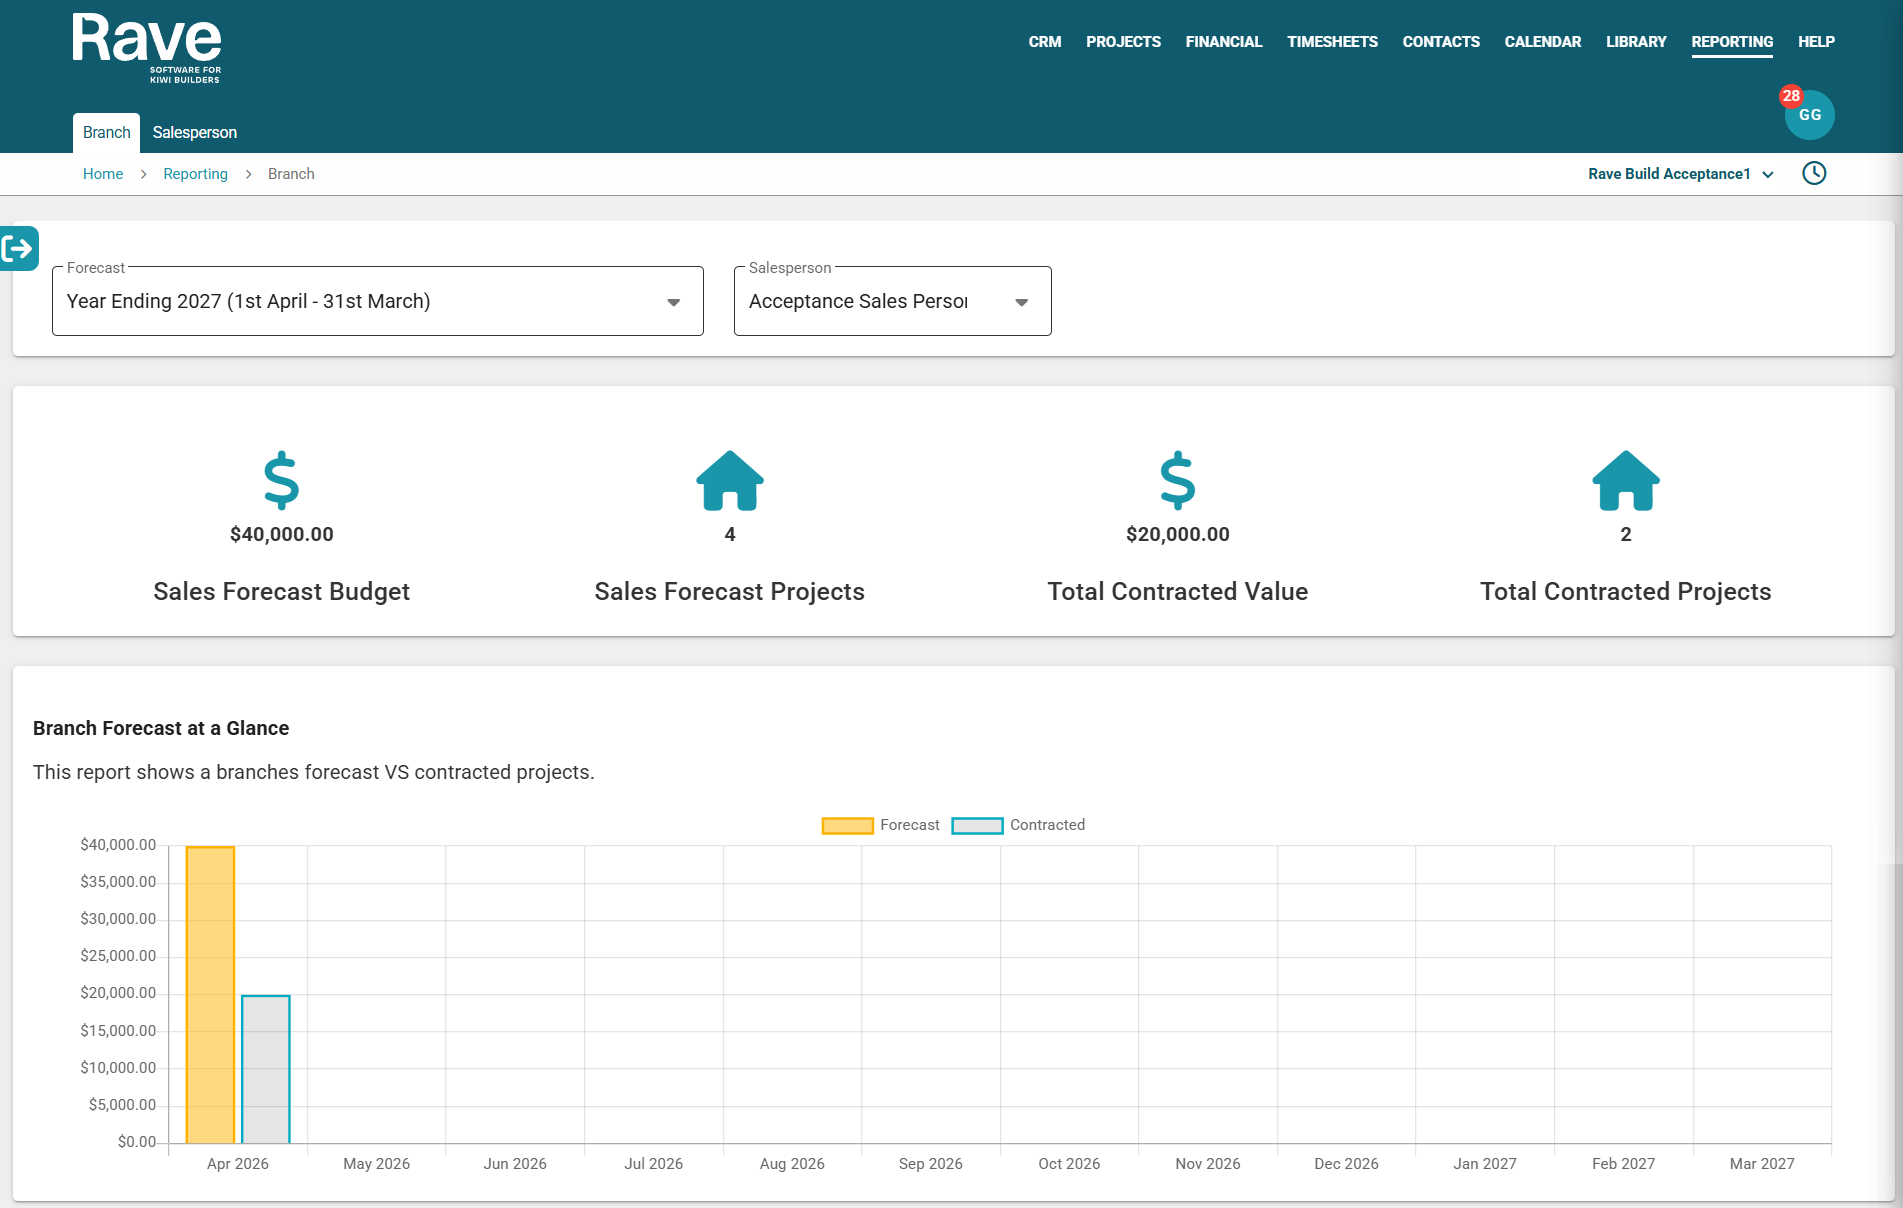
Along the top you have a Forecast Date selector to pick which Finanical year you want to view the data in as well as a salesperson selector.
If you leave the Salesperson blank, we will group all of the below Image results for ALL forecasts. Choosing a single user will only show their information.
The first images in the report displays:
Sales Forecast Budget $ Value
Number of Projects Forecasted
Total Signed Contract Value
Total Number of Signed Contracts
The Graph titled Forecast at a Glance displays:
If any sales have been contracted in the date range, actual sales in grey with a blue outline, compared to forecasted sales shown in yellow.
Hover over the bars to view detailed dollar amounts and the number of sales for each.
The bottom section of the report is the Branch Enquiries Forecast, covering the forecast year within the NZ financial year date range of March to April.
This section breaks down the following by the Forecast Year:
Number of enquiries received
Where those enquiries sit in the pipeline
How many have been marked as won or lost
Forecasted versus actual values
The report can be exported as a CSV for further analysis.

Tip: Due to its width, this report is often easier to review when downloaded as a CSV and opened in a spreadsheet tool like Excel or Google Sheets.
Was this article helpful?
That’s Great!
Thank you for your feedback
Sorry! We couldn't be helpful
Thank you for your feedback
Feedback sent
We appreciate your effort and will try to fix the article