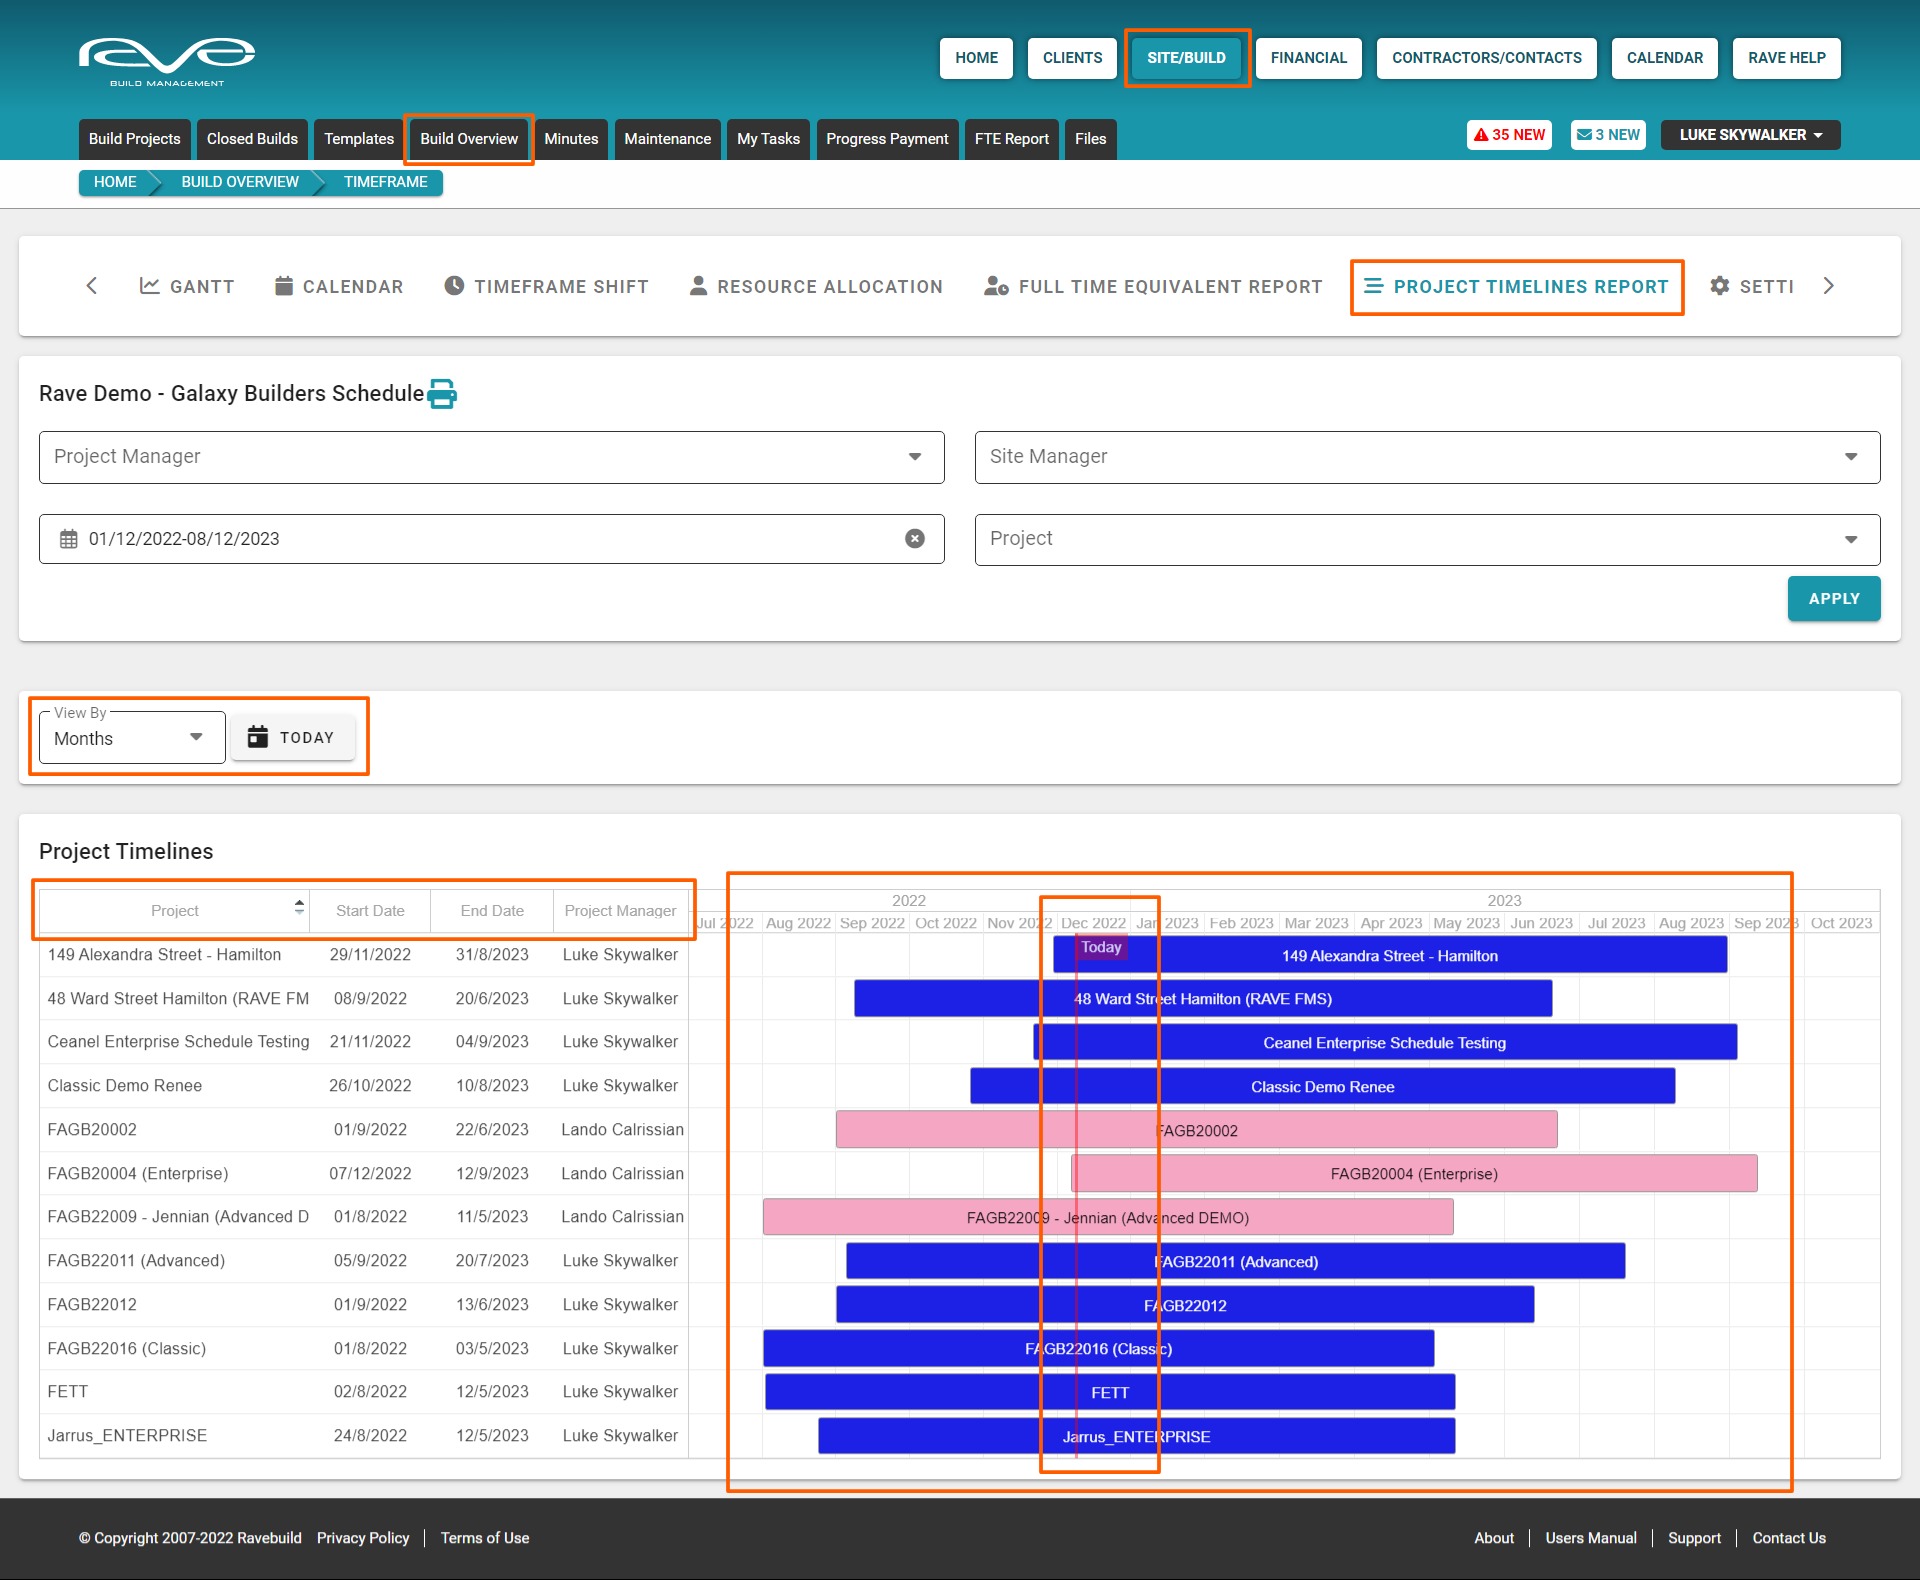
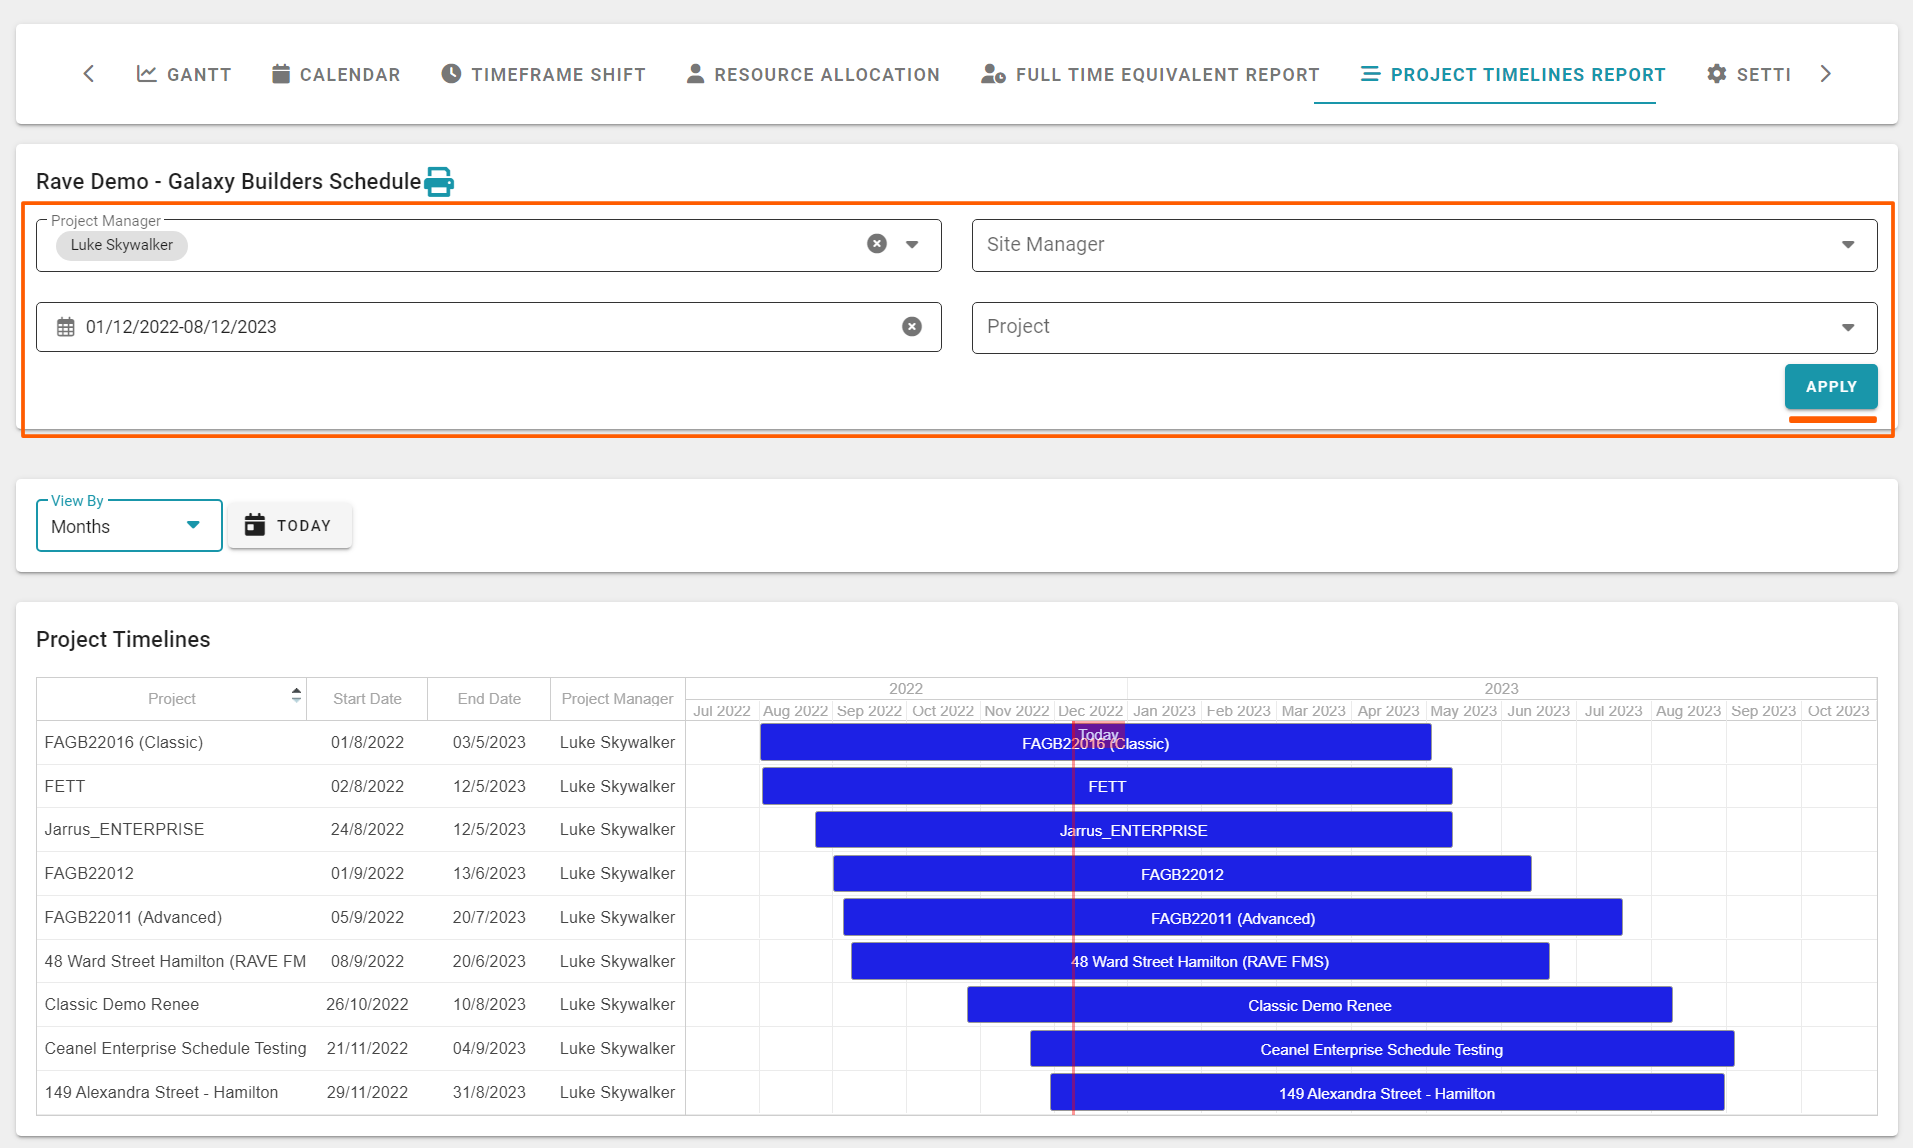
Our final cross-project report is the Project Timelines Report - available via Site|Build / Build Overview / Project Timelines Report. This provides a very top-level view of when your projects are due to start and finish, with handy colour coding by the project manager - prompting you to think about your current and future workload, and also helping you to identify when you need to start slotting in your next lot of work.
Again we have a number of super handy filter options, plus the ability to export your Project Timelines Report for printing – we’ll show you how to do this shortly.
The Project Timelines Report is pretty straightforward:
- We list your project number + contract name
- The start date of your first task in each schedule
- The finish date of your last task in each schedule
- And the project manager's name
- the column headers are clickable, allowing you to sort by these
- the data in the columns are clickable – taking you to the Milestone view of that project - We have the chart display to right, visually showing:
- the start and finish of your schedule
- the project number + contract name
- and each project manager is colour coded – allowing you quickly and easily identify which project is being managed by which project manager.
- today’s date line, allows you to instantly view how far through your project timelines you are
- To the top left, we have the ‘View By’ selector allowing you to zoom in/out by day, week, fortnight, month, and year.
- And the ‘Today’ button, which snaps the gantt chart back so the dateline is positioned at the centre of the gantt.
Running a Project Timelines Report using the Build Overview Filters
At the top of the ‘Project Timelines Report’ build overview page, are a number of reporting filter options – these are available for most of the Build Overview reports, and allow you to create your own customised reports – these are:
- Project Manager – project managers can view ALL projects or just their own projects
- Site Managers – allow project managers to view jobs run by a specific Site Manager(s)
- Date Range – filter the chart display to a specific date range period
- Project – allow project managers to view the chart across a selection of specific jobs
Once you have set your filter options, click ‘Apply’ at the bottom right of the filters, to apply your selections to the report.
Printing your Project Timelines Report
Once you have applied your filters, you have the ability to export your Project Timelines Report for printing. This is via the printer icon to the right of the job number – above the Project Timelines Report filters, to the left.
To print your Project Timelines Report:
- Click the printer icon (to the right of your job number) – this will open the ‘Print Schedule Gantt Chart’ pop-up
- From here you just select
- The ‘view by’ scale setting you want your print out to display as
- Select the start and finish dates of the range you want to display
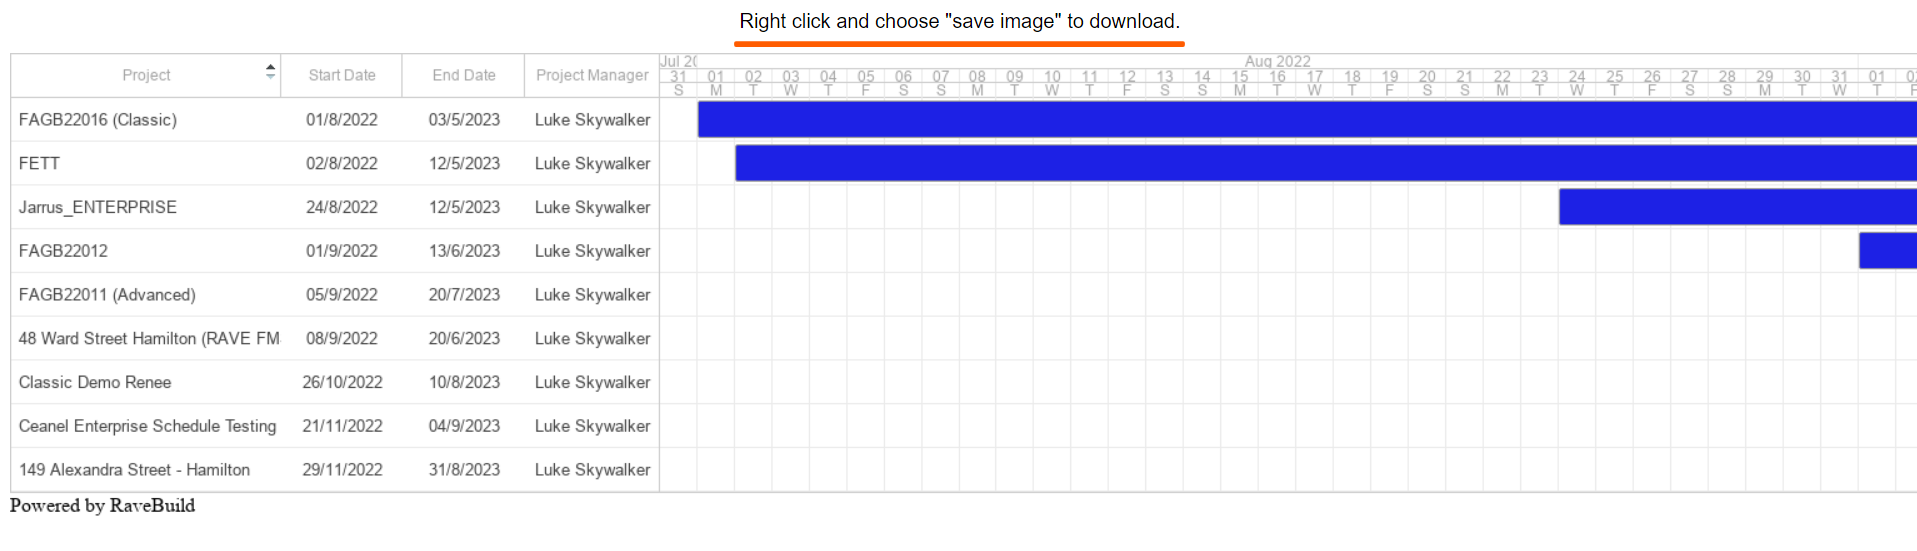
- And then click ‘Print’ to print – this will open a new tab previewing your Project Timelines Report view
- From here we ‘right click’ on the web page, and select ‘Save Image As’
- This will open your file browser pop-up giving you the chance to save this as a picture file and where to save it to
- Click ‘Save’ to save it
- Then open your saved image file of the Project Timelines Report to print.