In this FAQ, we will learn how easy it is to use RAVE's cross-project reporting tools - to help you better manage multiple projects, your staffing resources, and your project timelines.
We access your branches cross projects reports via the Site|Build / Build Overview sub-tab – which will default to your business’ Key Tasks build overview.
The Key Tasks Build Overview Report
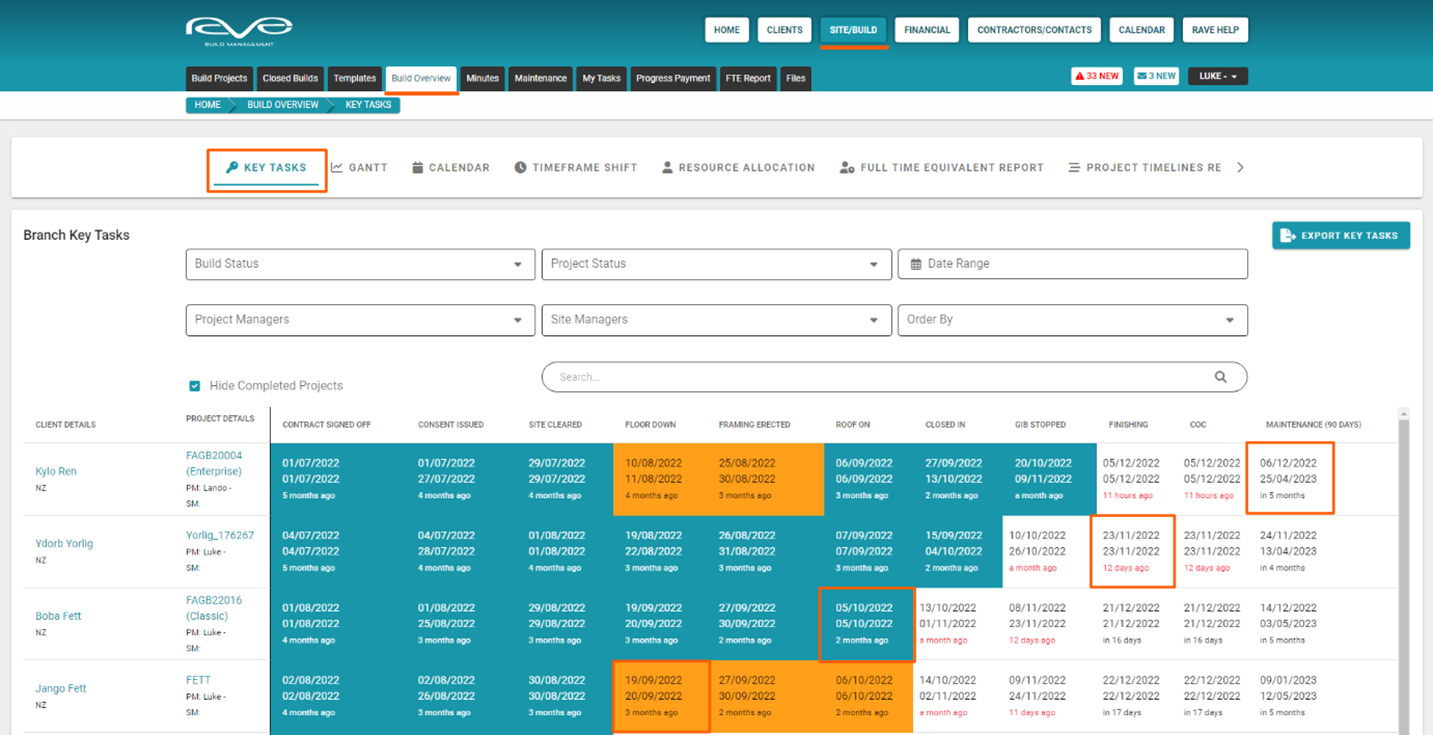
The Key Task overview (available via Site|Build / Build Overview sub-tab / Key Tasks) allows you to track key moments in your projects’ schedules – often relating (but not limited to) your stage claim payment requests i.e. signing the build contract, getting the building consent, completing the floor down stage, framing up, roof on, etc.
An example of a full Key Tasks build overview is included below, allowing you to see:
- Due dates for upcoming key tasks – which have a white background block with black due date text
- Due dates for overdue key tasks – which have a white background block with red overdue date text
- Completed key tasks – represented by the teal background block
- Completed key tasks with a payment request requested – represented by the golden background block
As you can see this is a great little ‘four-dimensional' report that provides you with a clear top-level overview of project progress. But if you’re new to this report, it is likely that you’re looking at a blank overview with no data. Your active projects, with activated schedules, will appear here when at least one task in their schedule has been tagged as a key task. We have created a standard Key Task list to get you started (and we’ll show you how to customise your Key Task list a little later), so let’s look at how to assign your Key Tasks for this report.
Tagging a Schedule Task as a Key Task
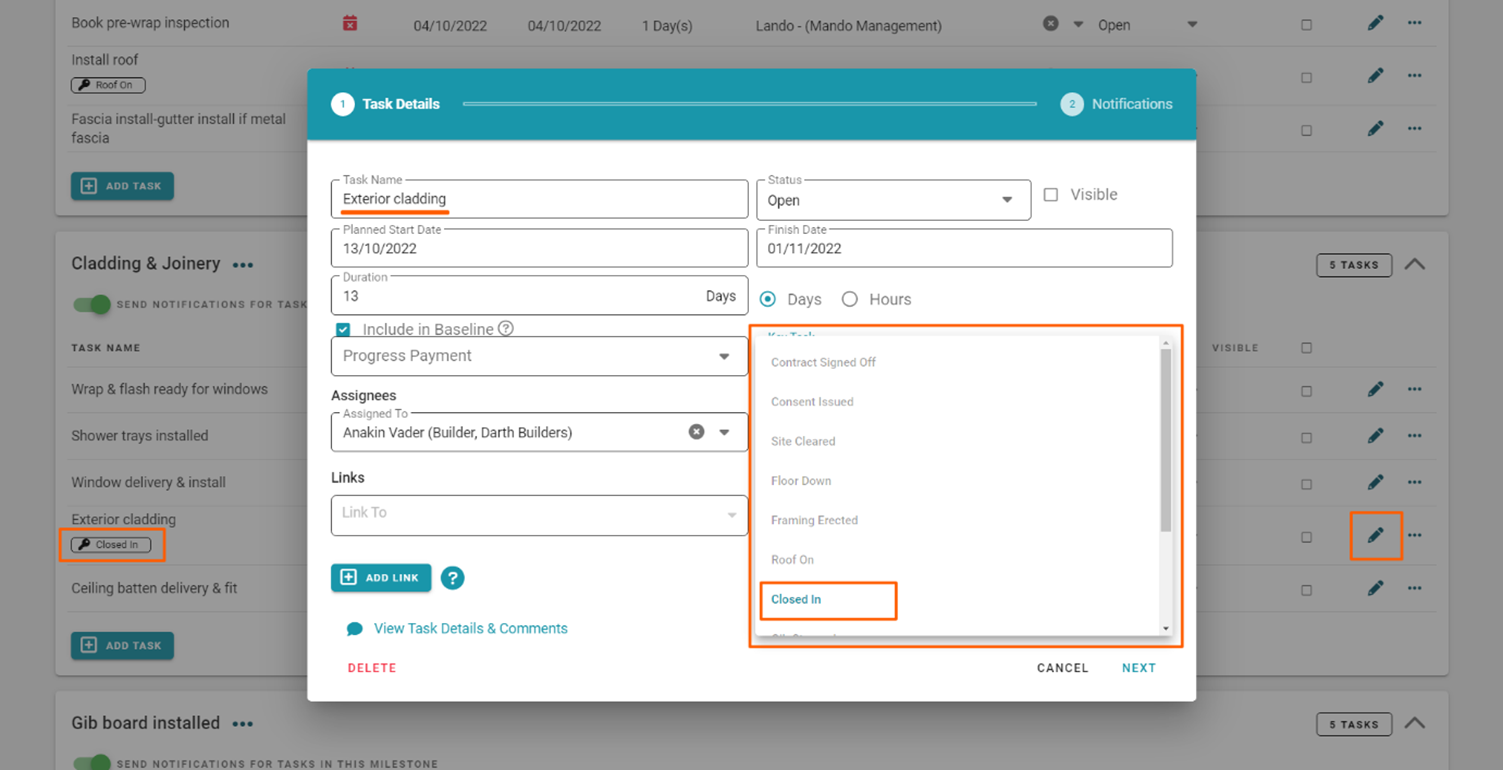
You can tag a schedule task as a key task by:
- Going to the Task List view of your schedule
- Choosing a task to assign i.e. a contract being signed task
- Clicking on the pencil edit icon to the right of the task – to open the Task Details pop-up
- From here we move over to the Key Task dropdown and select the relevant Key Task tag i.e. Contract Signed Off
- Then click ‘Next’ and/or ‘Save’ to confirm
This will take you back to your Task List view, and after a few moments, you’ll see a black Key Task tag labeled ‘Contract Signed Off’ will appear. Going back to your Key Tasks build overview report (and assuming that your project is active, and your schedule is activated) you’ll see that your project has been added to the Key Tasks report and the Contract Signed Off block has been populated with task dates.
You can short-cut back to your schedule by clicking on the job number and tag your remaining Key Tasks.
Note: You can only assign one task to a Key Task tag – and you’ll notice when you assign your next Key Task, that already assigned tags are grayed out, and can not be selected again. However, if you’ve made a mistake, you can remove a Key Task tag, and then reassign it to another task.
RAVE Hack: Once you’ve tagged all of your Key Tasks in your schedule, you can save a new schedule template – this will also save your Key Tasks too, so the next time you load up this schedule template, your Key Tasks will load with their Key Task tags, and your project will auto-populate into your Key Tasks build overview report too!
Running a Key Tasks report using the Build Overview Filters
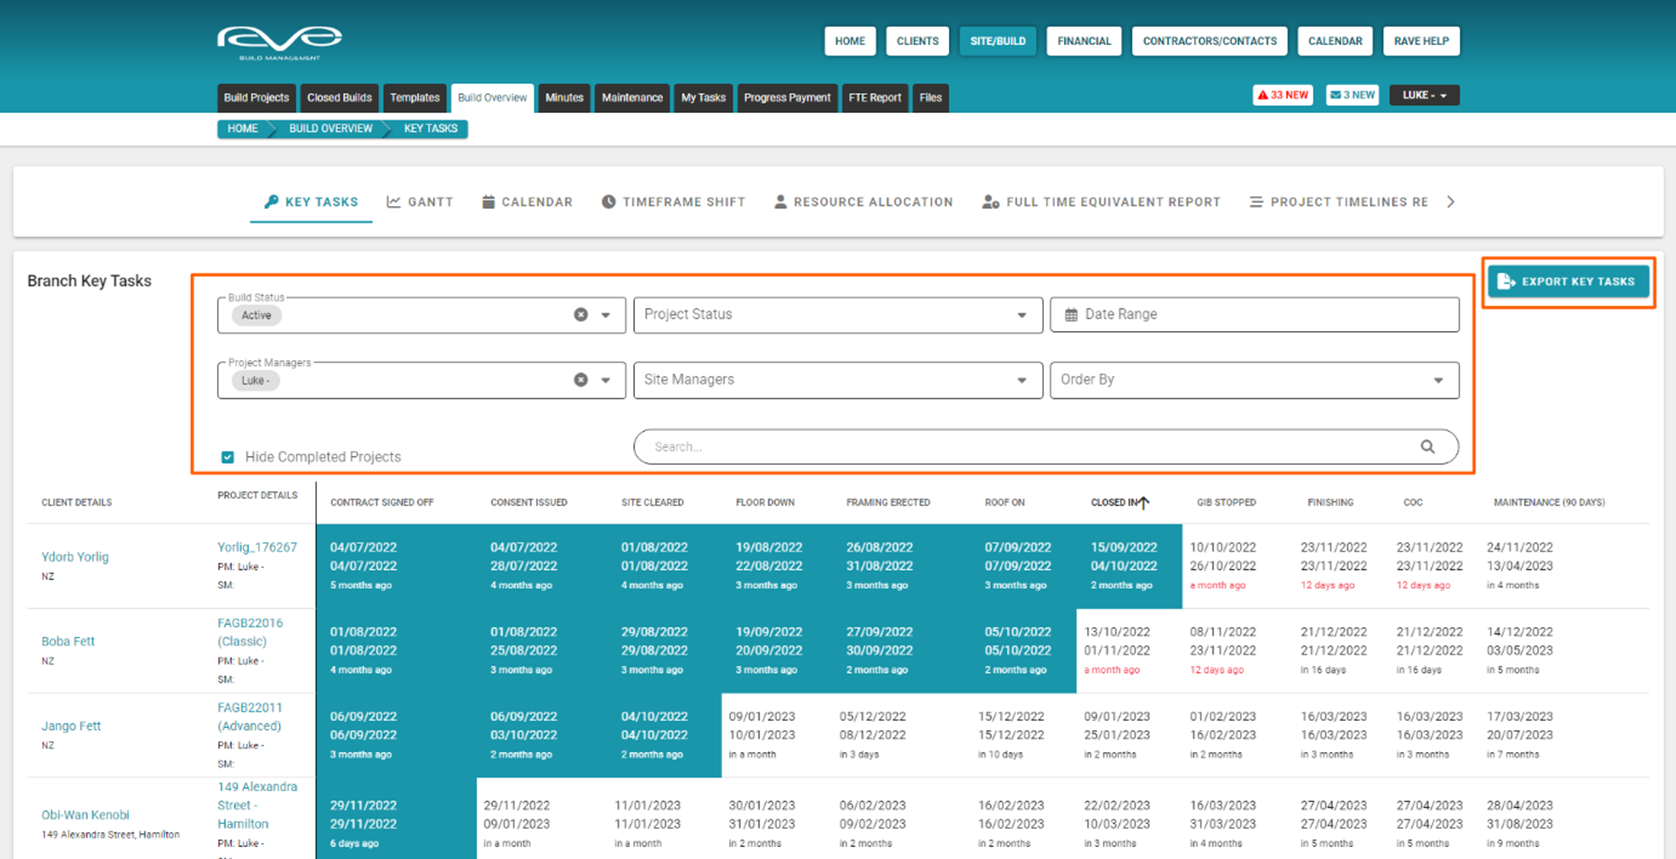
At the top of the ‘Key Tasks’ build overview page, are a number of reporting filter options – these are available for most of the Build Overview reports, and allow you to create your own customised reports – the Key Task filters are:
- Build Status – filter projects by their Active and/or Maintenance state
- Project Status – filter projects by their stage of construction i.e. Preconstruction, In Construction, etc.
- Date Range – allows you to view Key Tasks due in a specific date range period
- Project Managers – project managers (as an example) can easily view just their own projects, a selection of project managers' projects, or ALL projects
- Site Managers – allows you to view jobs managed by specific Site Manager(s)
- Order By – changes the ordering down the page i.e. by the Schedule Start Date, Task Start Date, or Task End Date
- The Search field – allows you to filter projects by their Job Number, Contract Name, or the Client’s Name
- You also have the ability to Hide Completed Projects via the ‘Hide Completed Projects’ checkbox
Once you have applied your filters, you have the ability to export your report for printing, or as a CSV file, via the Export Key Tasks button – at the top right of the page.
Printing (and Exporting) your Key Tasks report
Once you have applied your filters, you have the ability to print or export your Key Tasks report - this is via the Export Key Tasks button - to the top right of the page.
- Export for Printing
Clicking on the Export for Printing option - will immediately generate an image file for you to print from - refer to the example below
NOTE: The Key Task printing process includes the creation of an image file - this is to provide you with more printing flexibility – if your printer supports ’poster' or 'tile’ printing, you can blow the Gantt chart image up over 2 or more pages (x pages wide by y pages high), allowing you print an enlarged version of your gantt charts without the need for a larger printer.
For more details on this process please refer to this RAVE Help article - Printing a Task Gantt view - Schedule Chart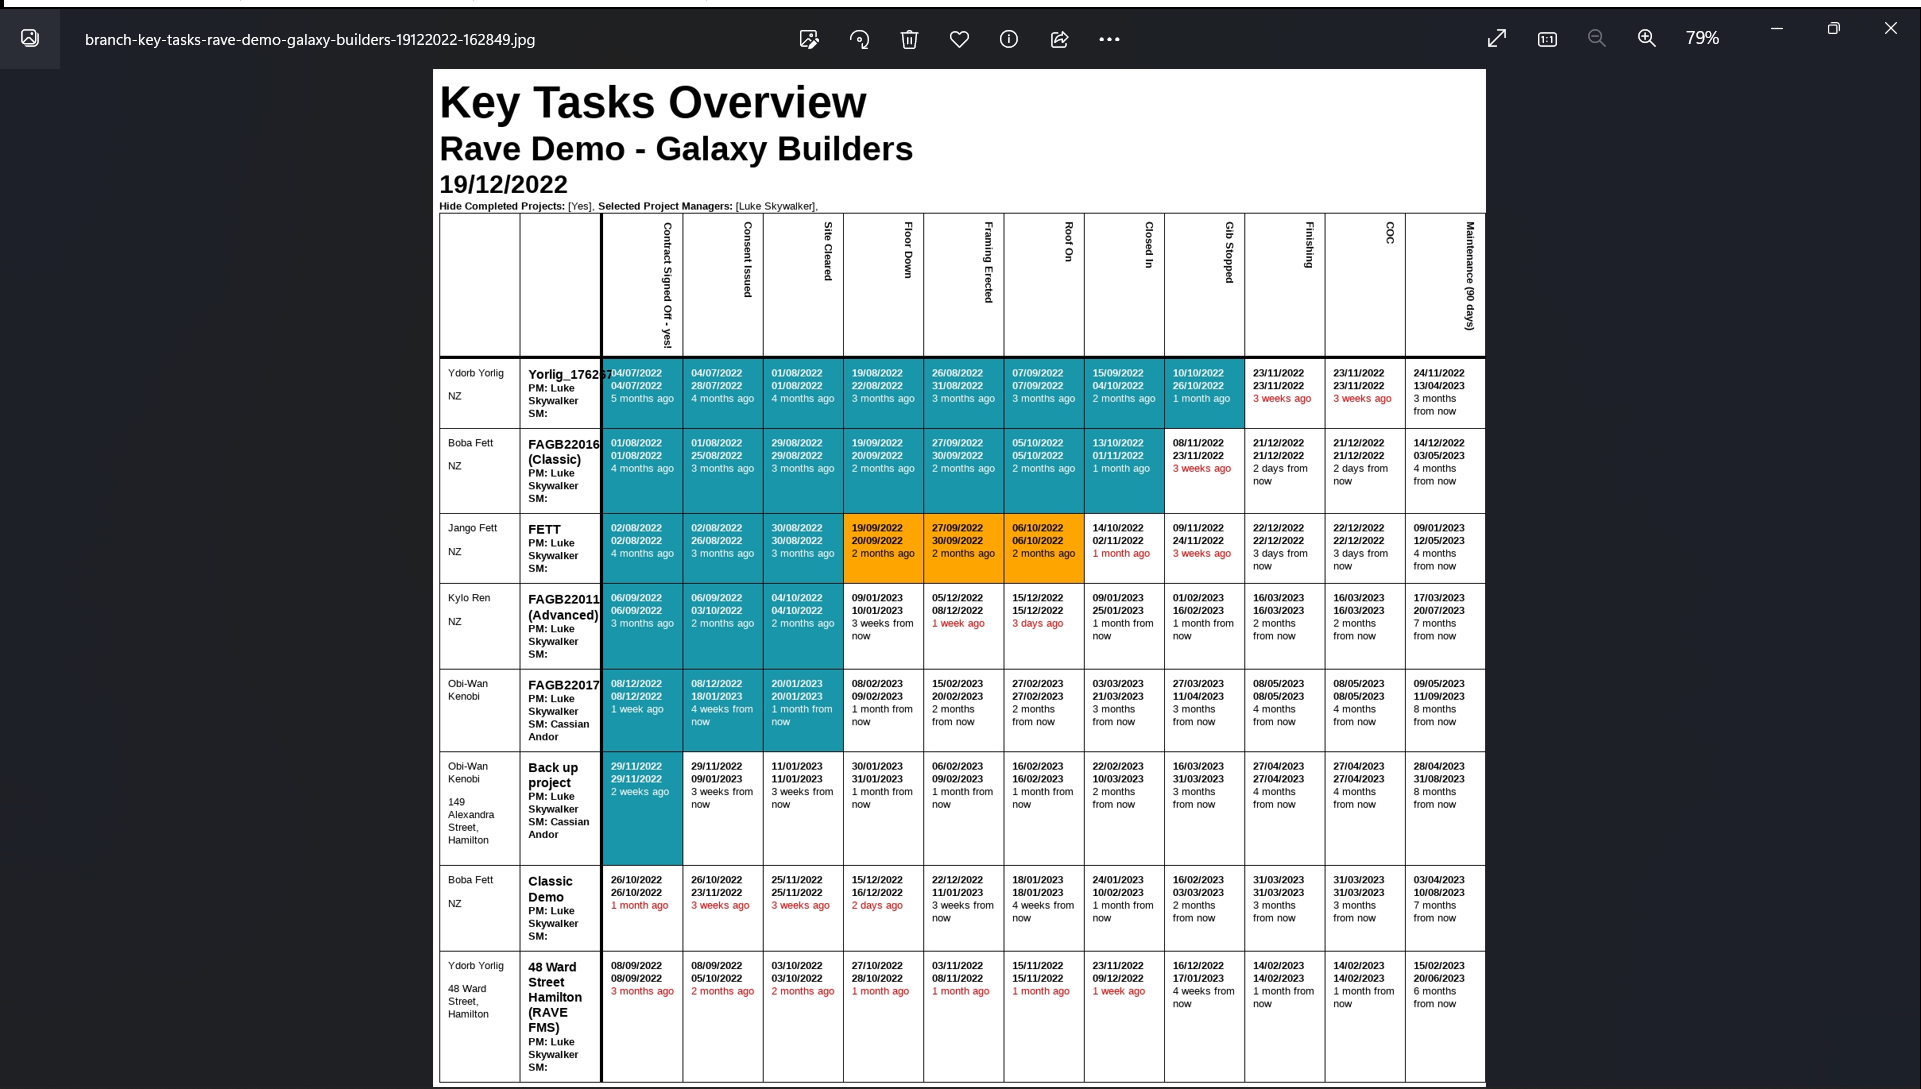
- Export to CSV
The Export to CSV option, allows you to customise your CSV export report by:- Showing the Key Task End Dates - instead of just displaying the Key Task Start Dates
- Showing the Key Task Completion Status - displayed as an 'X' (for completed tasks), instead of a dot '.' (for open tasks) on the report
Once you've made your selections, click on the Export to CSV button to create a CSV version of your report - refer to the example below
How to Customise your Key Task list
Those with branch owner permissions can easily update their business’s Key Task tag list in RAVE, you can access your Key Task list by:
- Clicking on your profile dropdown – your name in black to the top right of your RAVE screen
- Selecting ‘Settings’
- Then clicking on the Key Tasks sub-tab – at the top left of the Branch Settings page
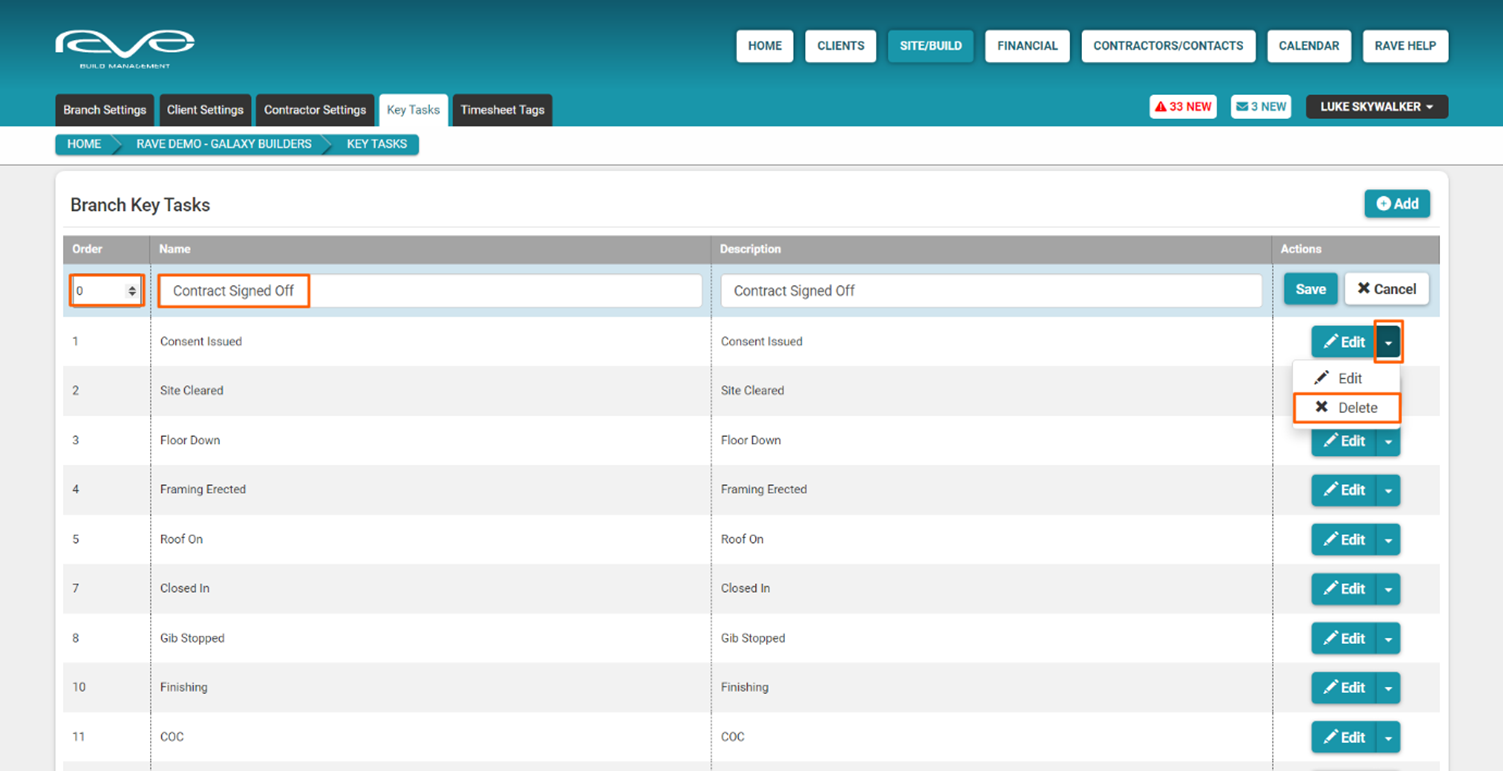
This will display your Branch Key Tasks list.
- The order of your Key Tasks down the page is the order these will display (left to right) across your Key Tasks build overview report.
- The Key Task Name and Description column are generally the same, but it is the ‘Name’ field that dictates what is displayed on the report.
You have a few editing options via the Edit button, and the Actions dropdown menu to delete a Key Task tag – both are over to the far right of a Key Task. You can edit your Key Task tag list by:
- Clicking either ‘Edit’ option, you can then:
- Change the order of Key Tasks by clicking on the 'Order' number you want to move, then editing the number, or clicking on the up and down triangles
- Edit the Key Task ‘Name’ (and description if you want to) by clicking on the respective field, and typing in what you want to display.
- You can save your Key Task tag changes by clicking on the Actions ‘Save’ button.
- And again, you can delete a Key Task tag by clicking ‘Delete’ via the Actions dropdown menu
---
The Gantt Build Overview Report
The next report is the Gantt build overview - available via Site|Build / Build Overview / Gantt. It’s just like your project’s Gantt view display, but allows you to display tasks across multiple projects, again with a number of super handy filter options, plus the ability to print a PDF version of your Gantt chart in addition to exporting it – we’ll show you how to do this shortly.
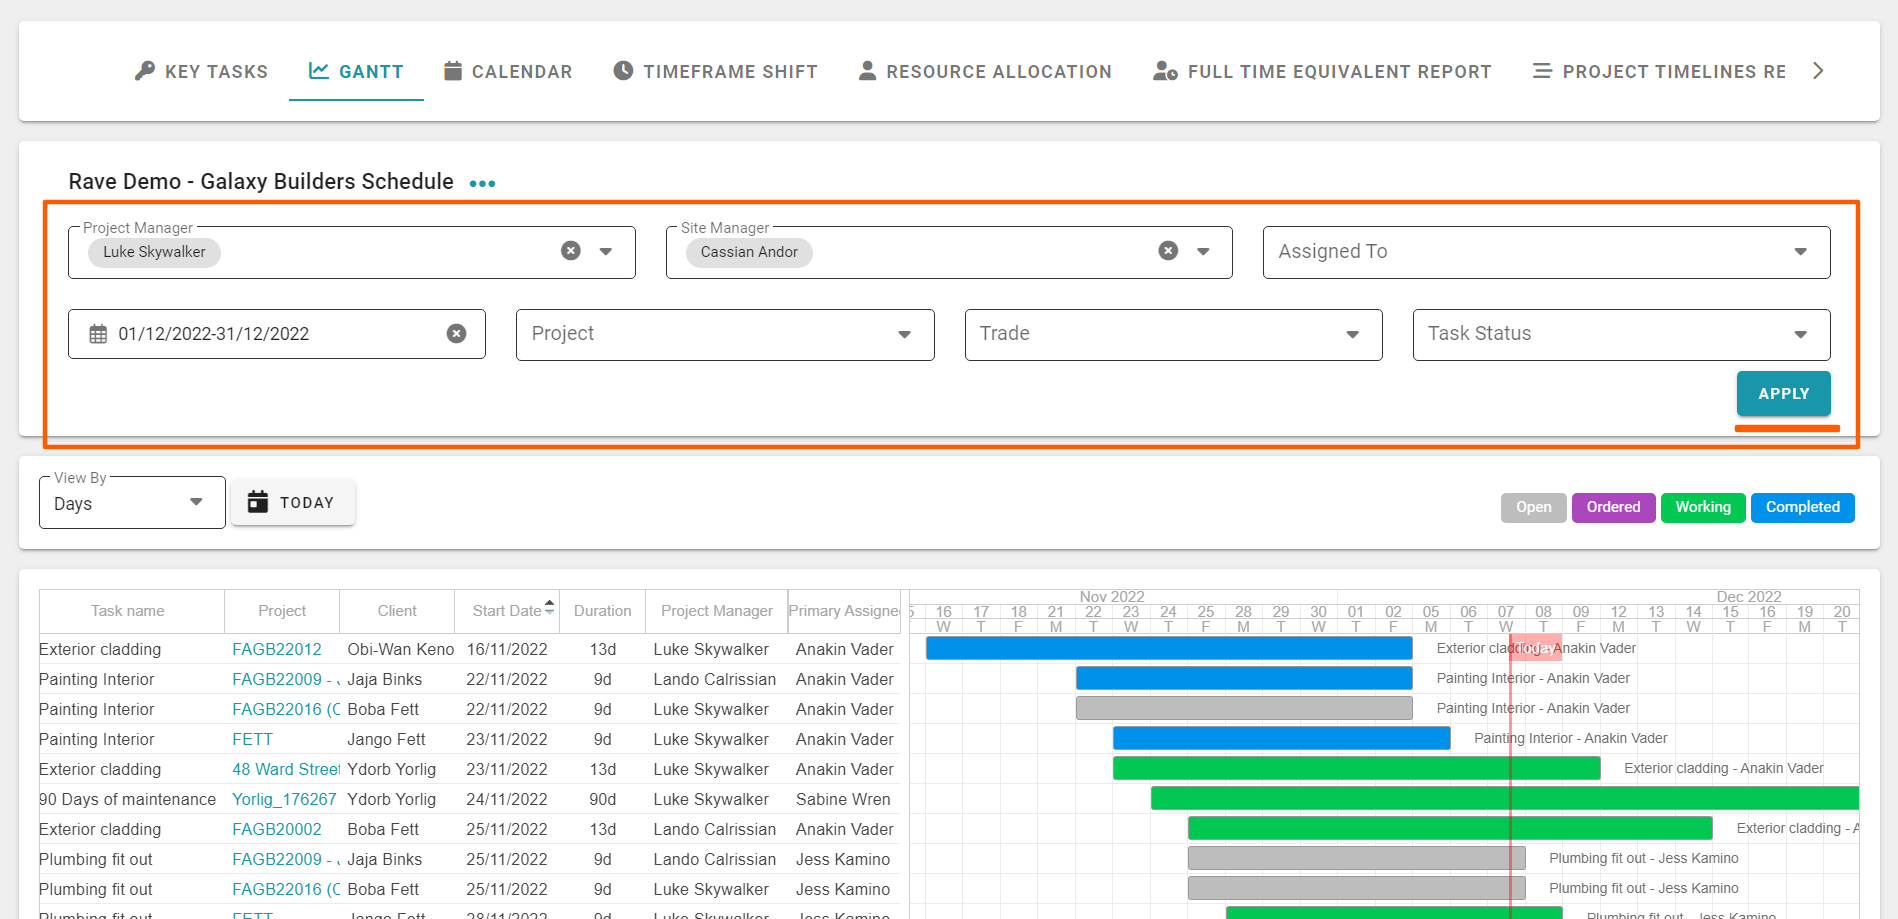
Just like your single project Gantt View:
- We list your task details (task name, start date, and duration) plus the job number, project manager and task assignee
- the column headers are clickable, allowing you to sort by these
- the job number is clickable – taking you to the Task List view of that project for quick editing - We have the gantt display to the right, with today’s date line, allowing you to instantly view tasks falling behind – via our gantt colour coding (displayed to the top right) i.e. any tasks in an open (grey) or ordered (purple) state to the left of the date line may be something for the project manager to chase up.
- To the top left, we have the ‘View By’ selector allowing you to zoom in/out by day, week, fortnight, month and year.
- And the ‘Today’ button, which snaps the gantt chart back so the date line is positioned to the centre of the gantt

Running a Gantt report using the Build Overview Filters
At the top of the ‘Gantt’ build overview page, are a number of reporting filter options – these are available for most of the Build Overview reports, and allow you to create your own customised reports – these are:
- Project Status – filter projects by their stage of construction i.e. Preconstruction, In Construction, etc.
- Project Manager – project managers can view just their projects, a selection of project manager's projects, or ALL projects
- Site Managers – allows you to view jobs managed by specific Site Manager(s)
- Assigned To – allows you to view tasks assigned to specific task assignee(s)
- Date Range – allows you to view tasks due in a specific date range
- Project – allows you to view the gantt across a selection of specific jobs
- Trade – allows you to view tasks assigned to specific trade(s)
- Task Status – allows you to filter tasks that are in a specific state i.e Open, Ordered, Working, and Completed
Once you have set your filter options, click ‘Apply’ to the bottom right of the filters, to apply your selections to the report.
Printing (and Exporting) your Gantt report
Once you have applied your filters, you have the ability to print, or to export your Gantt build overview report as a CSV file. This is via the 3 dot action dropdown to the right of the job number – to left, above the gantt filters.
To print your Gantt build overview report:
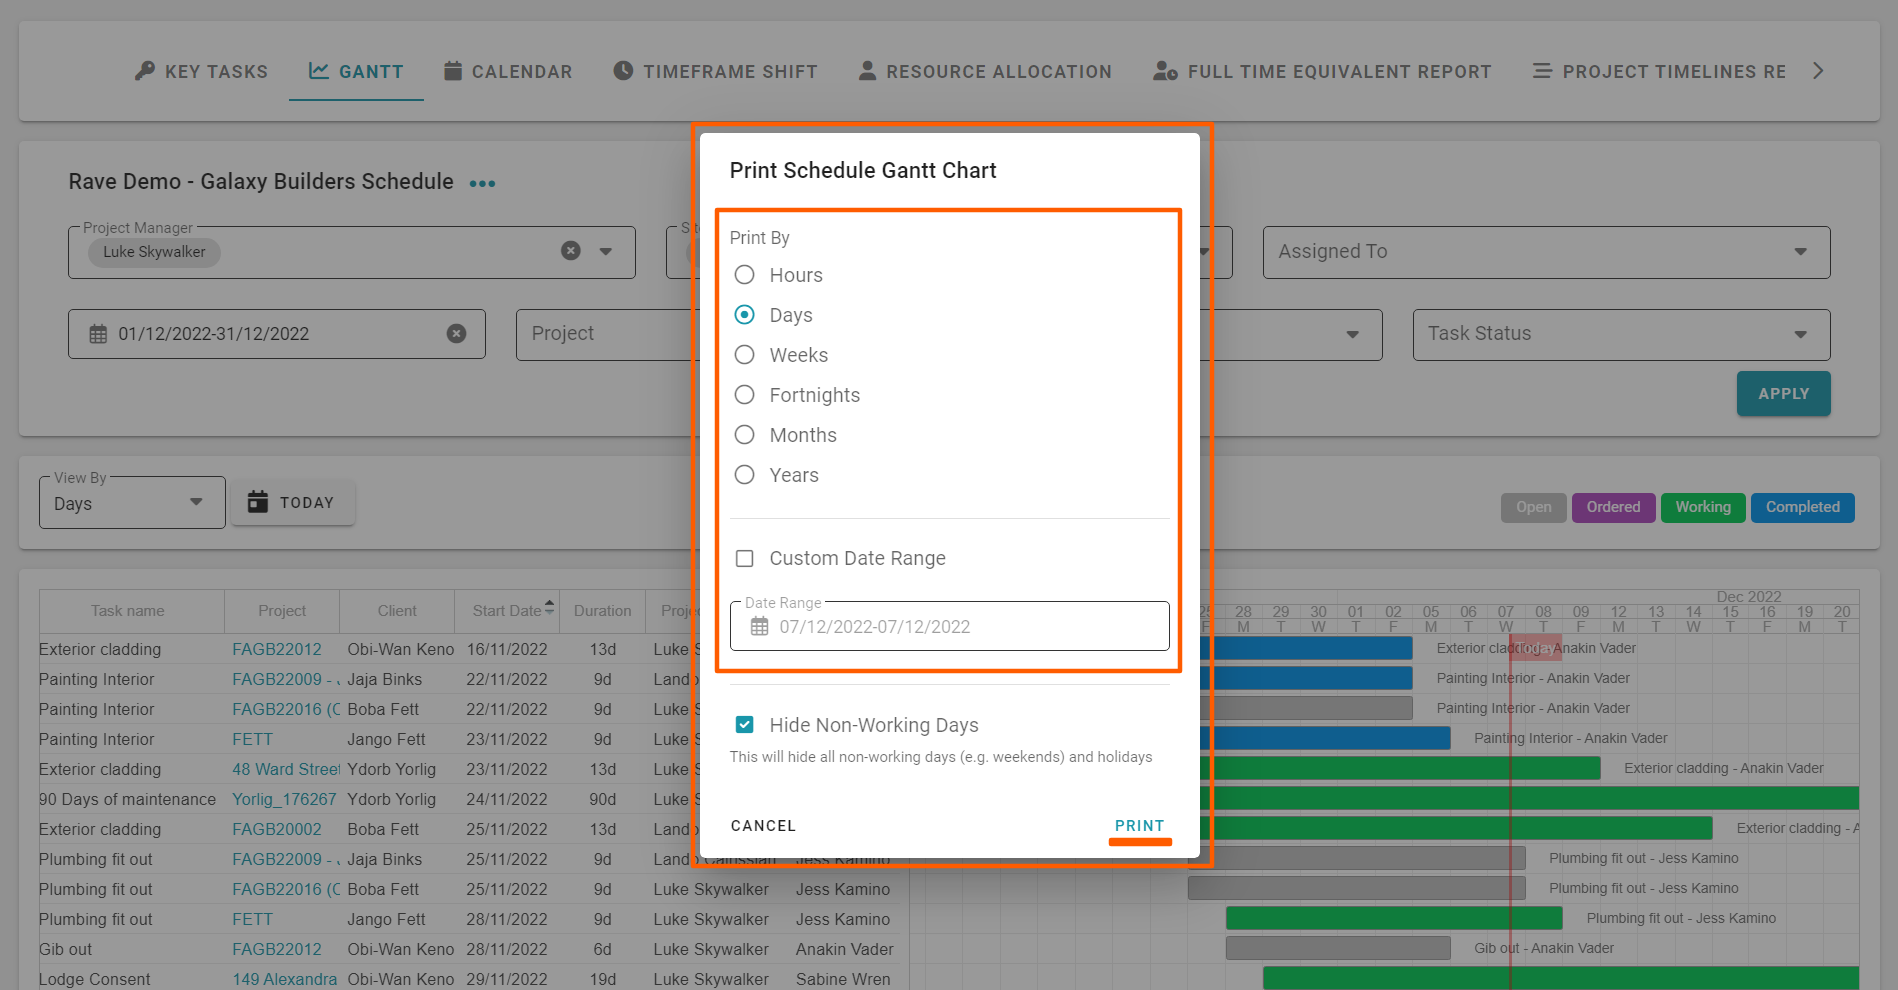
- Select the 'Print Gantt' option – this will open the ‘Print Schedule Gantt Chart’ pop-up
- From here you just select
- The ‘print by’ scale setting you want your printout to display as
- Select the start and finish dates of the range you want to display
- Choose to hide (default) or display non-work periods i.e. weekends and holidays
- And then click ‘Print’ to print
- This will create a webpage preview of the gantt chart for printing. Right click and select ‘Save image as…’, to save as a .jpeg or .png image file, with your file name i.e. 'Solo Gantt Aug Sept.png'
- Then open your saved image file of the Gantt chart to print, and click on your printer icon to print it.
From here you will be able to print to whatever paper size, and scale you want i.e. fit to a page, or your own scale option. If your printer supports 'poster' or 'tile’ printing, you can blow the Gantt chart image file up over 2 or more pages (x pages wide by y pages high), allowing you to print an enlarged version of your gantt charts without the need for a larger printer.
For more details on this process please refer to this RAVE Help article - Printing a Task Gantt view - Schedule Chart
NOTE: If you require a PDF copy of your gantt chart, after step 6 above, select the 'Print to PDF' option instead of an actual printer, this will prompt you to select a file name and saving location for a PDF version of your gantt chart.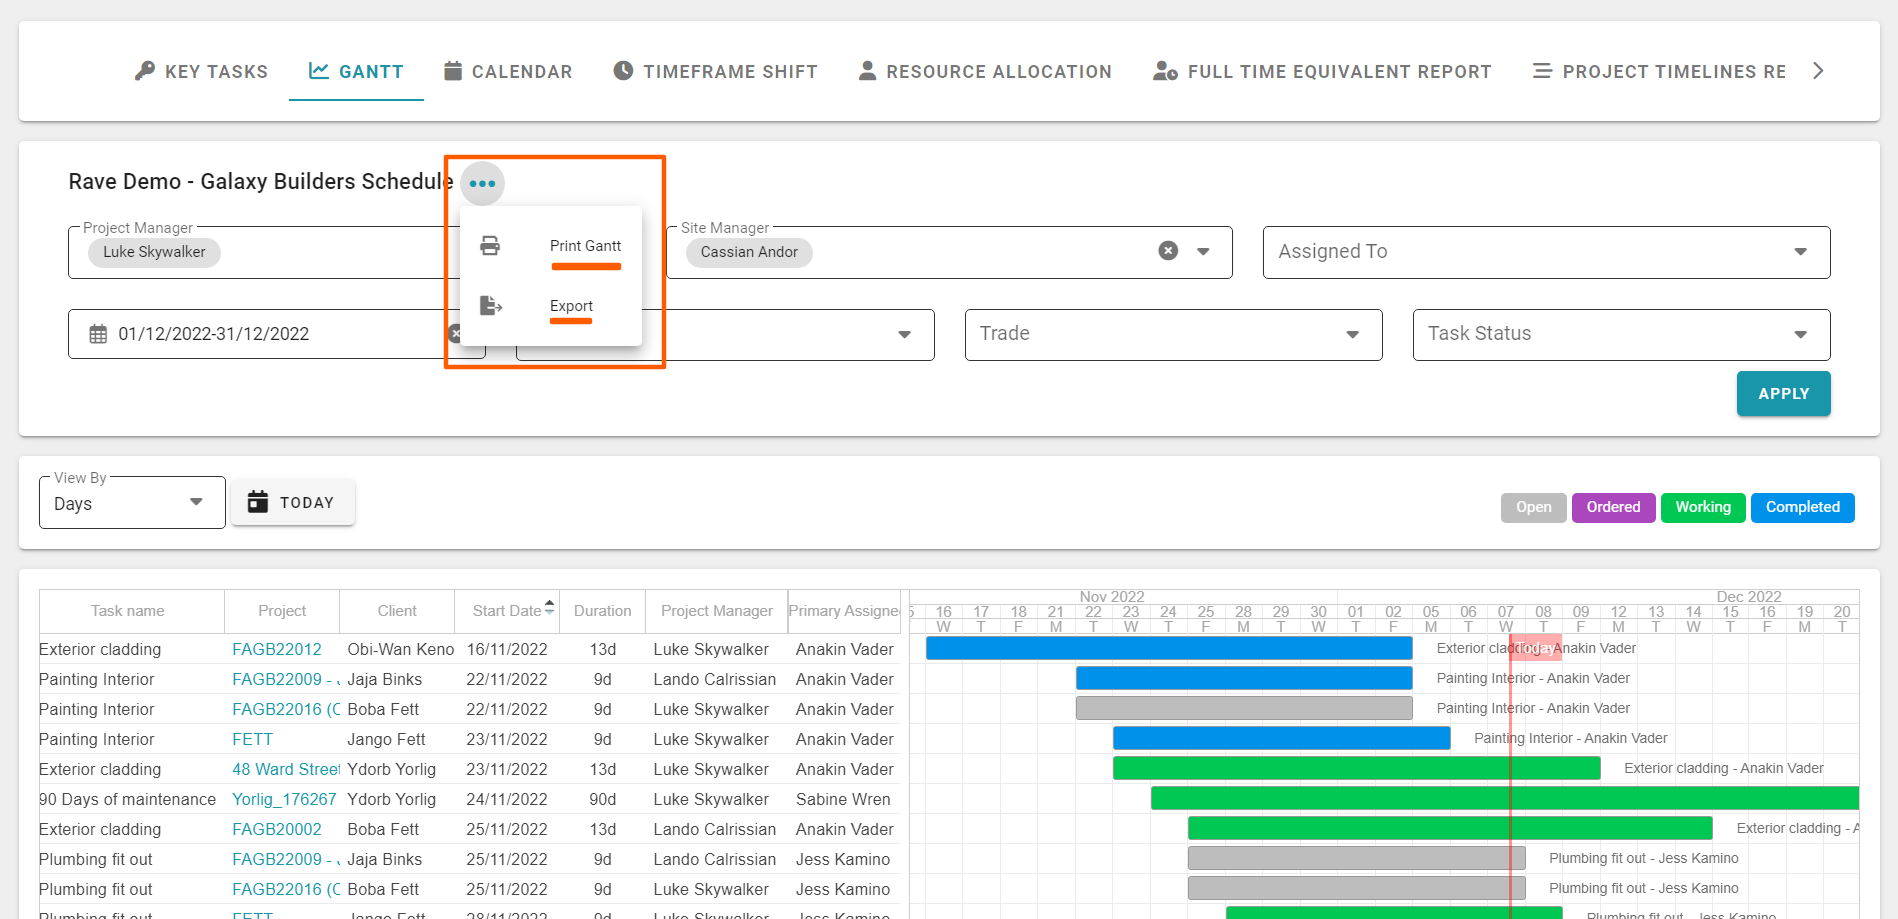

To Export your Gantt overview report as a CSV File:
Once you have applied your filters, you have the ability to export your Gantt build overview report as a CSV file. This is via the 3 dot action dropdown to the right of the job number – to left, above the gantt filters.
- Select the 'Export' option
This will generate (and download) a CSV version of your report - refer to the example below
---
The Calendar Build Overview Report
The next report is the Calendar build overview - available via Site|Build / Build Overview / Calendar. It’s just like your project’s Calendar view display, but allows you to display tasks across multiple projects, again with a number of super handy filter options, plus the ability to export your Calendar chart for printing – we’ll show you how to do this shortly.
This view is very popular with our ‘Old School’ project managers, though the ability to view multiple projects tasks can quickly fill this display up - just like your single project Calendar view:
- We display your task name over the periods that your tasks cover.
- Hovering over a task will pop up a display of its:
- Job Number
- Start and Finish dates
- Duration
- Each task block is clickable – taking you to the Task List view of that project for quick editing
- Today’s date is highlighted in light blue, allowing you to instantly view tasks falling behind – via our gantt colour coding (displayed to the top right) i.e. any tasks in an open (grey) or ordered (purple) state before today’s date may be something for the project manager to chase up.
- To the top left, we have the ‘View By’ selector allowing you to view your schedule by Month, Week or Day.
- With two calendar scrolling options
- The calendar icon to the top left – by the Day/Week/Month filter
- And the ‘< Today >’ link to the top right

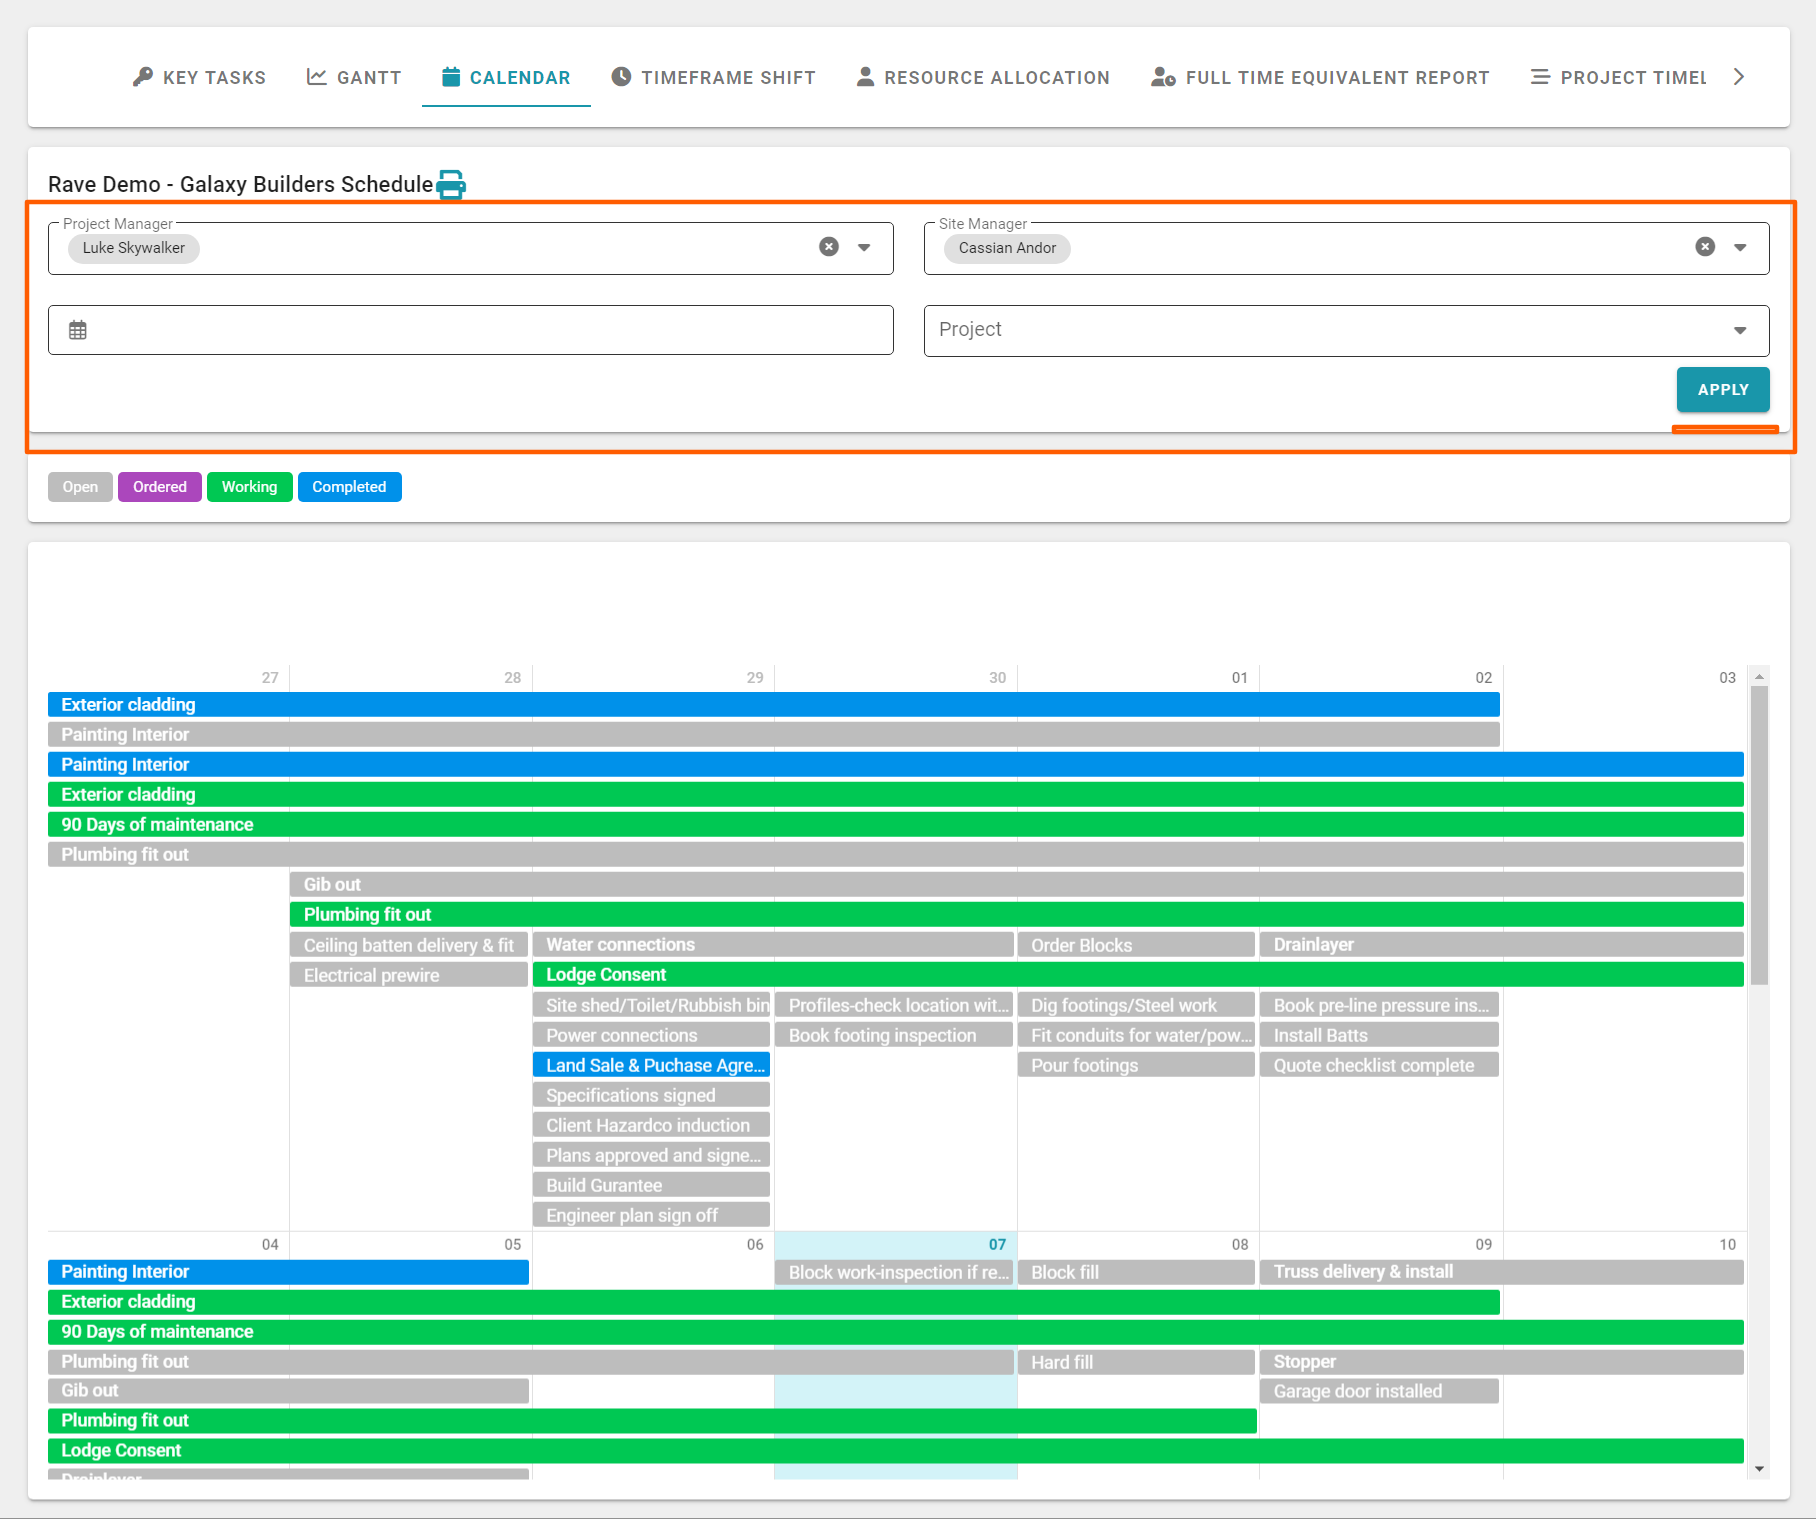
Running a Calendar report using the Build Overview Filters
At the top of the ‘Calendar’ build overview page, are a number of reporting filter options – these are available for most of the Build Overview reports, and allow you to create your own customised reports – these are:
- Project Manager – project managers can view just their projects, a selection of project managers projects, or ALL projects
- Site Managers – allows you to view jobs managed by specific Site Manager(s)
- Date Range – allows you to view tasks due in a specific date range
- Project – allows you to view the calendar across a selection of specific jobs
Once you have set your filter options, click ‘Apply’ at the bottom right of the filters, to apply your selections to the report.
Printing your Calendar report
Once you have applied your filters, you have the ability to export your Calendar chart for printing. This is via the printer icon to the right of the job number – above the calendar filters, to the left.
To print your Calendar build overview report:
- Click the printer icon (to the right of you job number)
- From the ‘Export Current Calendar View’ pop-up choose
- The size of paper you are going to print to i.e. A4, A3, A2 etc
- The orientation of the print out i.e. Landscape or Portrait
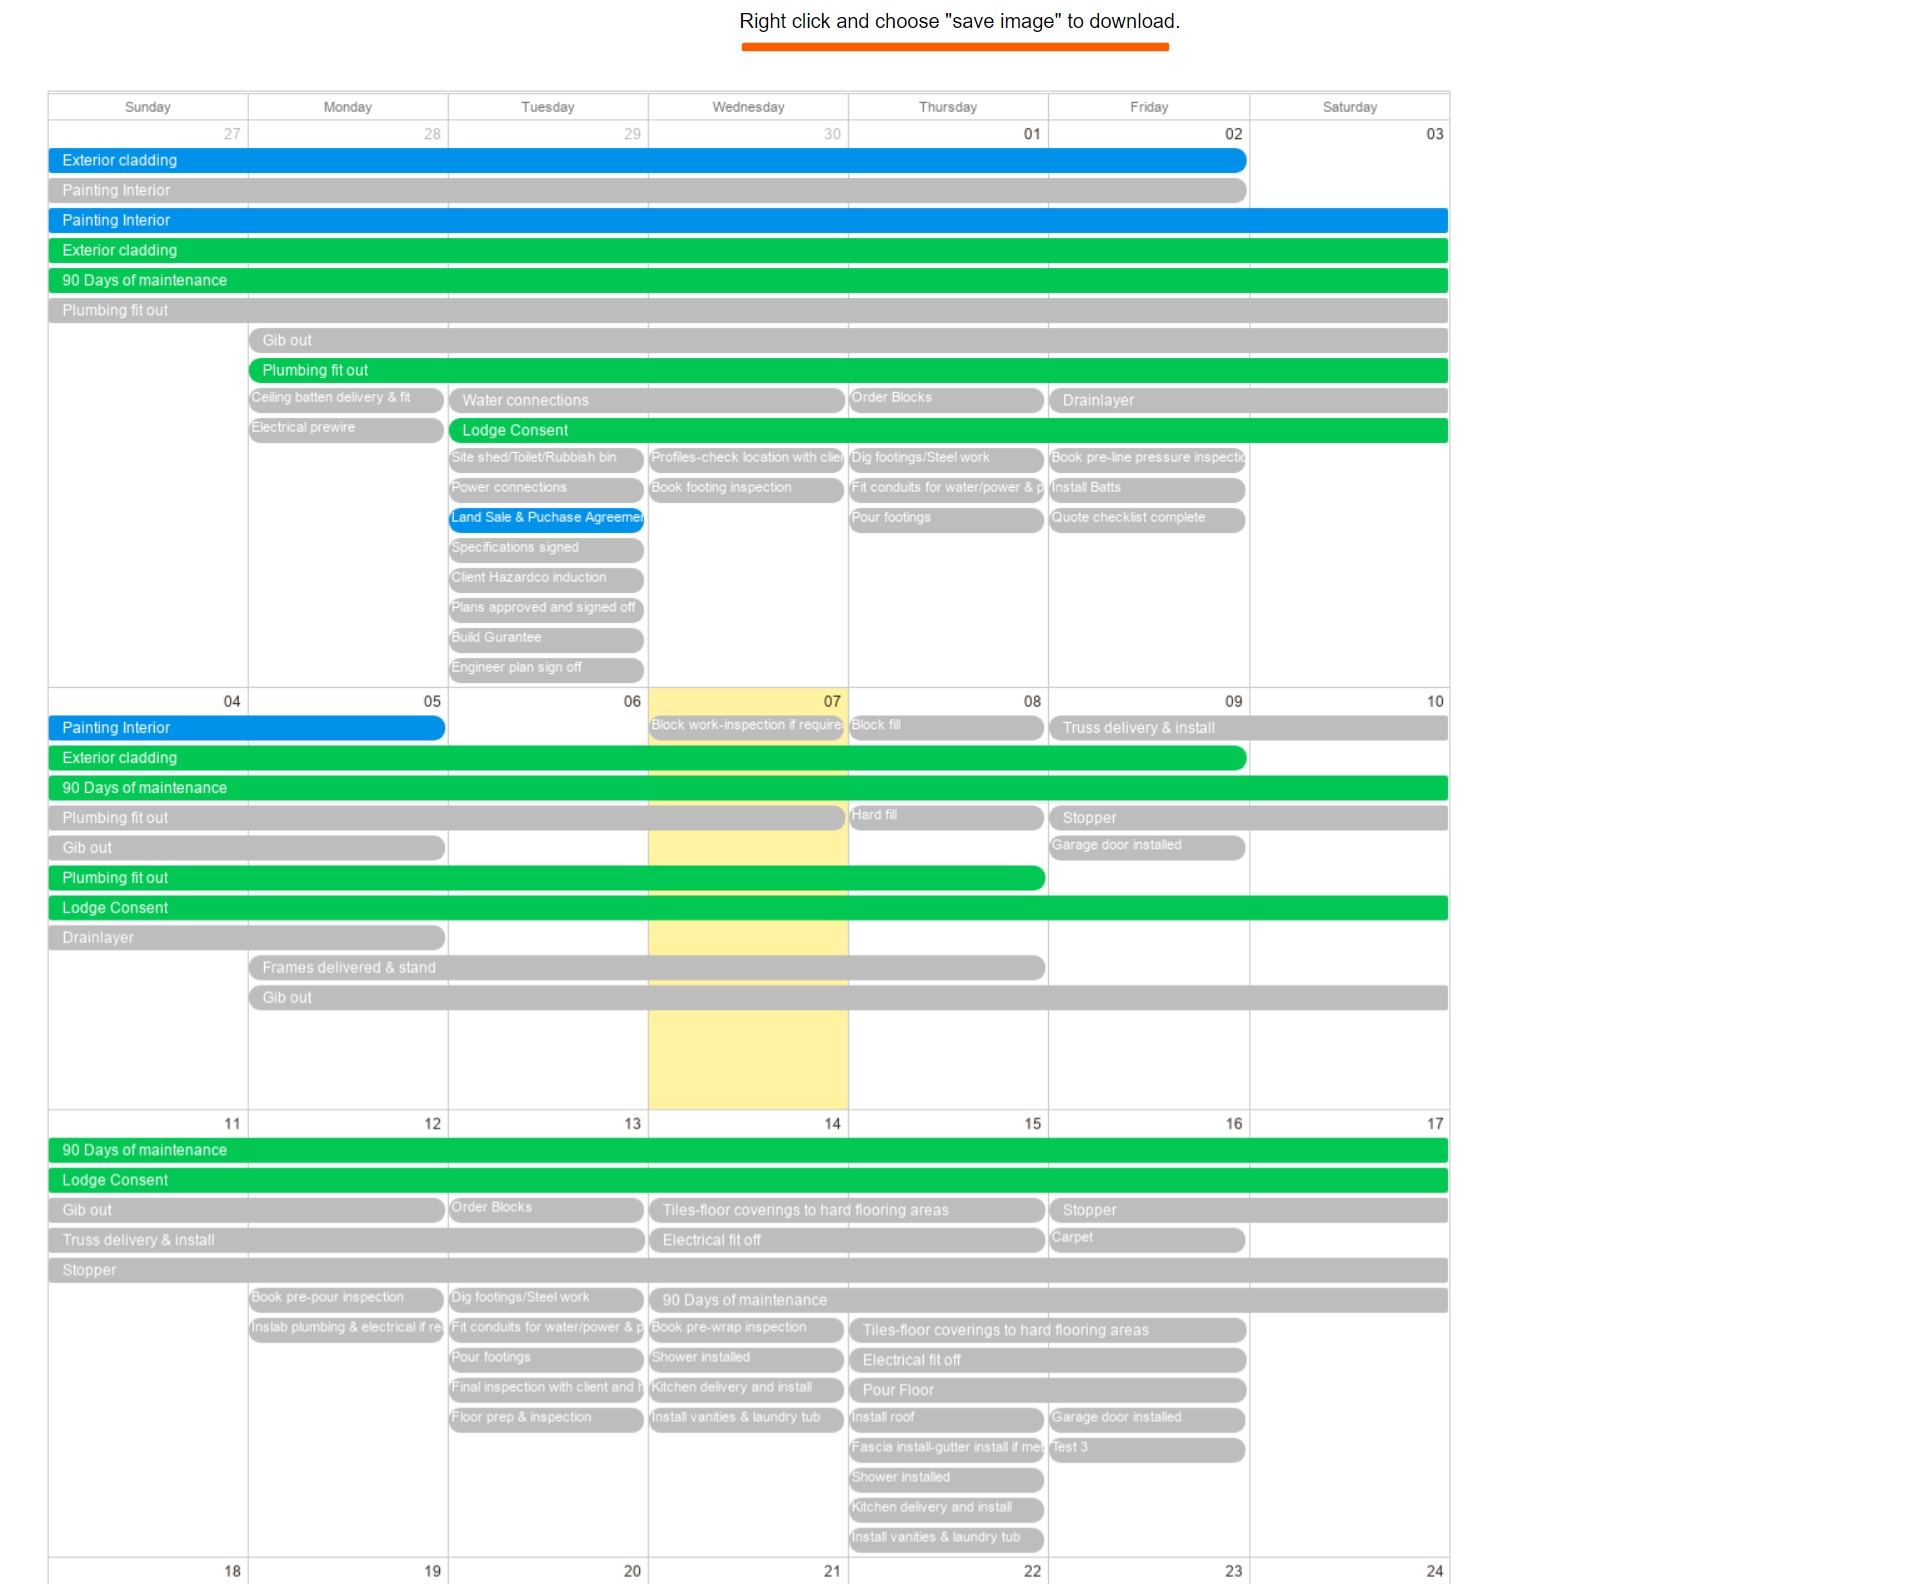
- And then click ‘Export’ to print – this will open a new tab previewing your calendar view
- From here we ‘right click’ on the web page, and select ‘Save Image As’
- This will open your file browser pop-up giving you the chance to save this as a picture file and where to save it to
- Click ‘Save’ to save it
- Then open your saved image file of the calendar report, and click on your printer icon to print it.
From here you will be able to print to whatever paper size, and scale you want i.e. fit to a page, or your own scale option. If your printer supports 'poster' or 'tile’ printing, you can blow the Gantt chart image file up over 2 or more pages (x pages wide by y pages high), allowing you to print an enlarged version of your gantt charts without the need for a larger printer.

---
The Timeframe Shift Build Overview Report
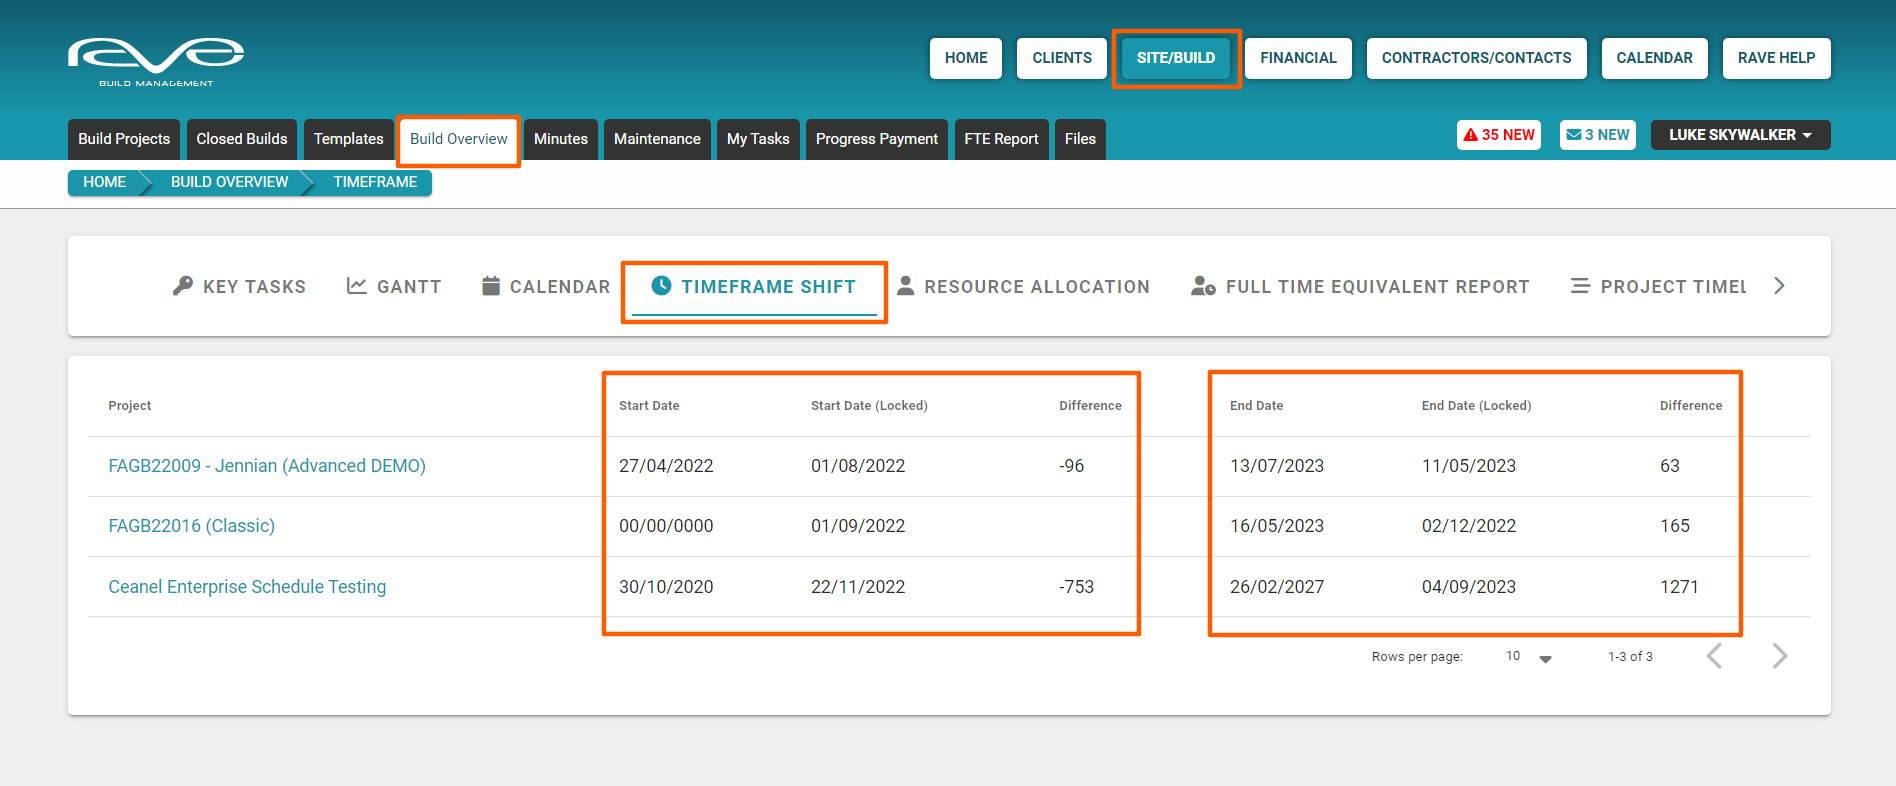
The next report is the Timeframe Shift build overview - available via Site|Build / Build Overview / Timeframe Shift. This is a high-level report showing the variation of your first and last task of any locked schedules - where the lock schedule baseline has been set.
Each project is listed down the page, while across the page we display:
- The first locked task in the schedule, specifically the:
- Start Date (current)
- The original (locked) Start Date
- The ‘Difference’ or variation between the two dates
- The last locked task in the schedule, specifically the:
- Start Date (current)
- The original (locked) Start Date
- The ‘Difference’ or variation between the two dates
---
The Resource Allocation Build Overview Report
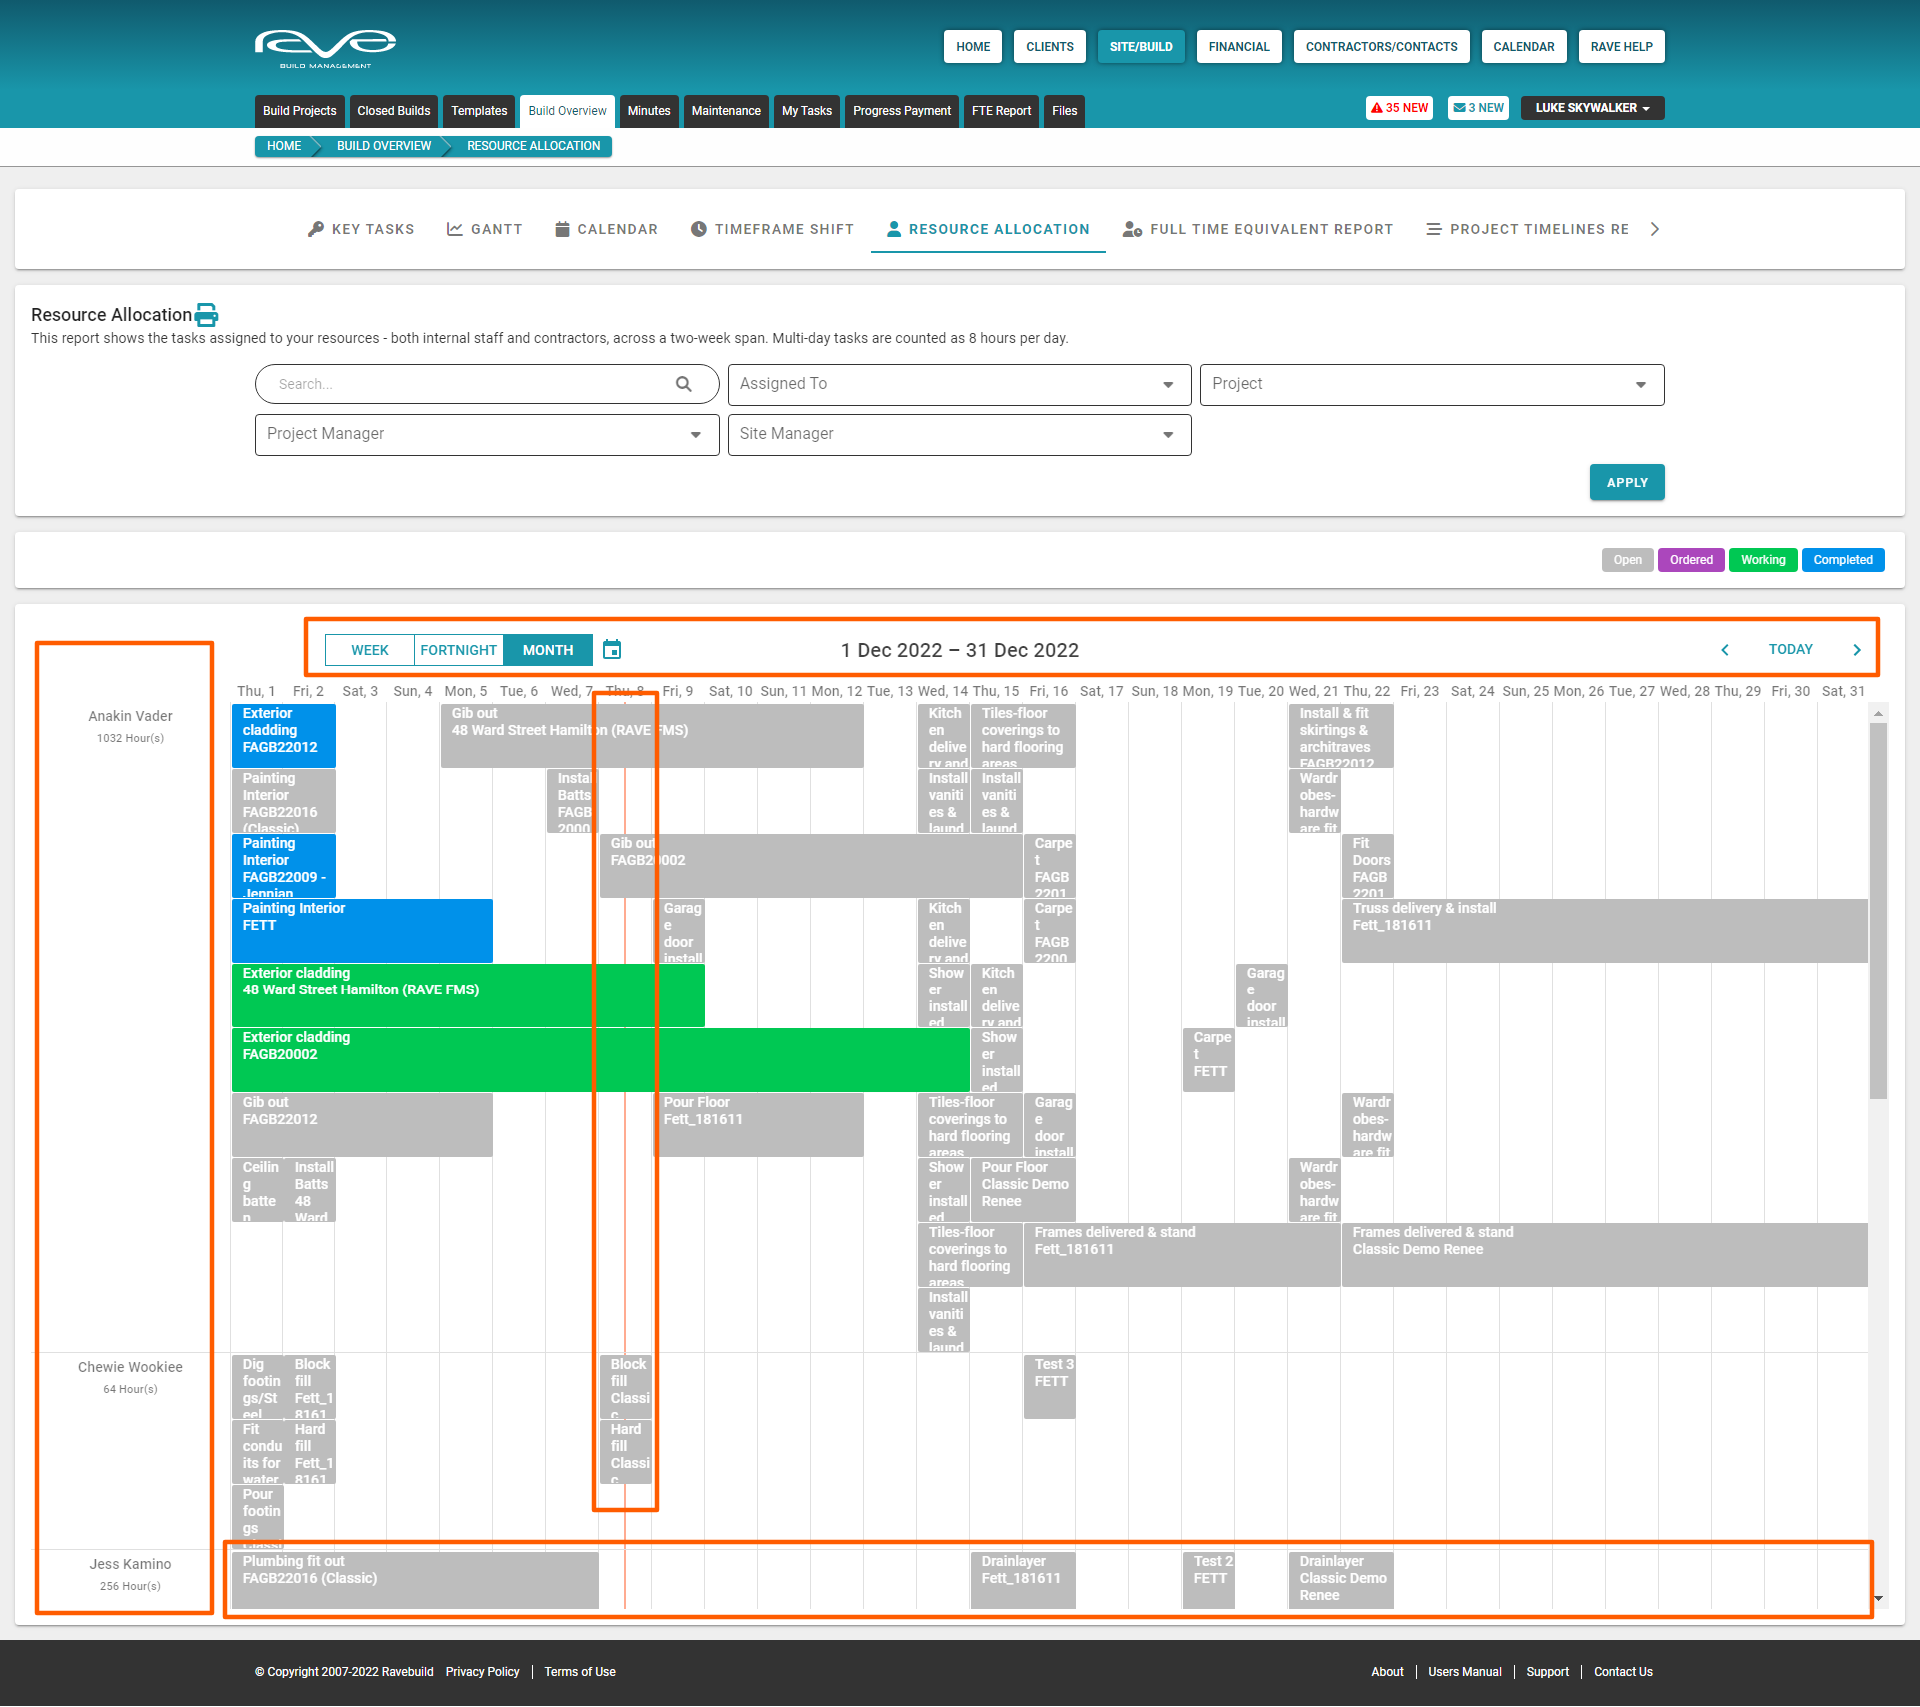
The next report is the Resource Allocation build overview - available via Site|Build / Build Overview / Resource Allocation. This report relies on your tasks being assigned out to staff and contractors – and once done, allows you to see task progress, and how busy your team and trades are via a month, fortnight or week view.
This very popular report displays:
- Your Staff Members and Tradees in first name alphabetical order
- With individual tasks displayed across their date range columns – each task displaying it’s
- Task description
- Job number
- Hovering over a task will pop-up a display of it’s:
- Task description
- Job number
- Start and Finish dates
- Duration
- Each task block is clickable – taking you to the Task List view of that project for quick editing
- This report includes today’s date line (assuming today’s date falls into the range of the report), allowing you to instantly view tasks falling behind – via our gantt colour coding (displayed to the top right) i.e. any tasks in an open (grey) or ordered (purple) state to the left of the date line may be something for the project manager to chase up.
- To the top left, we have the ‘View By’ selector allowing you to zoom in/out by day, week, fortnight, month and year.
- With two calendar scrolling options
- The calendar icon to the top left – by the Day/Week/Month filter
- And the ‘< Today >’ link to the top right
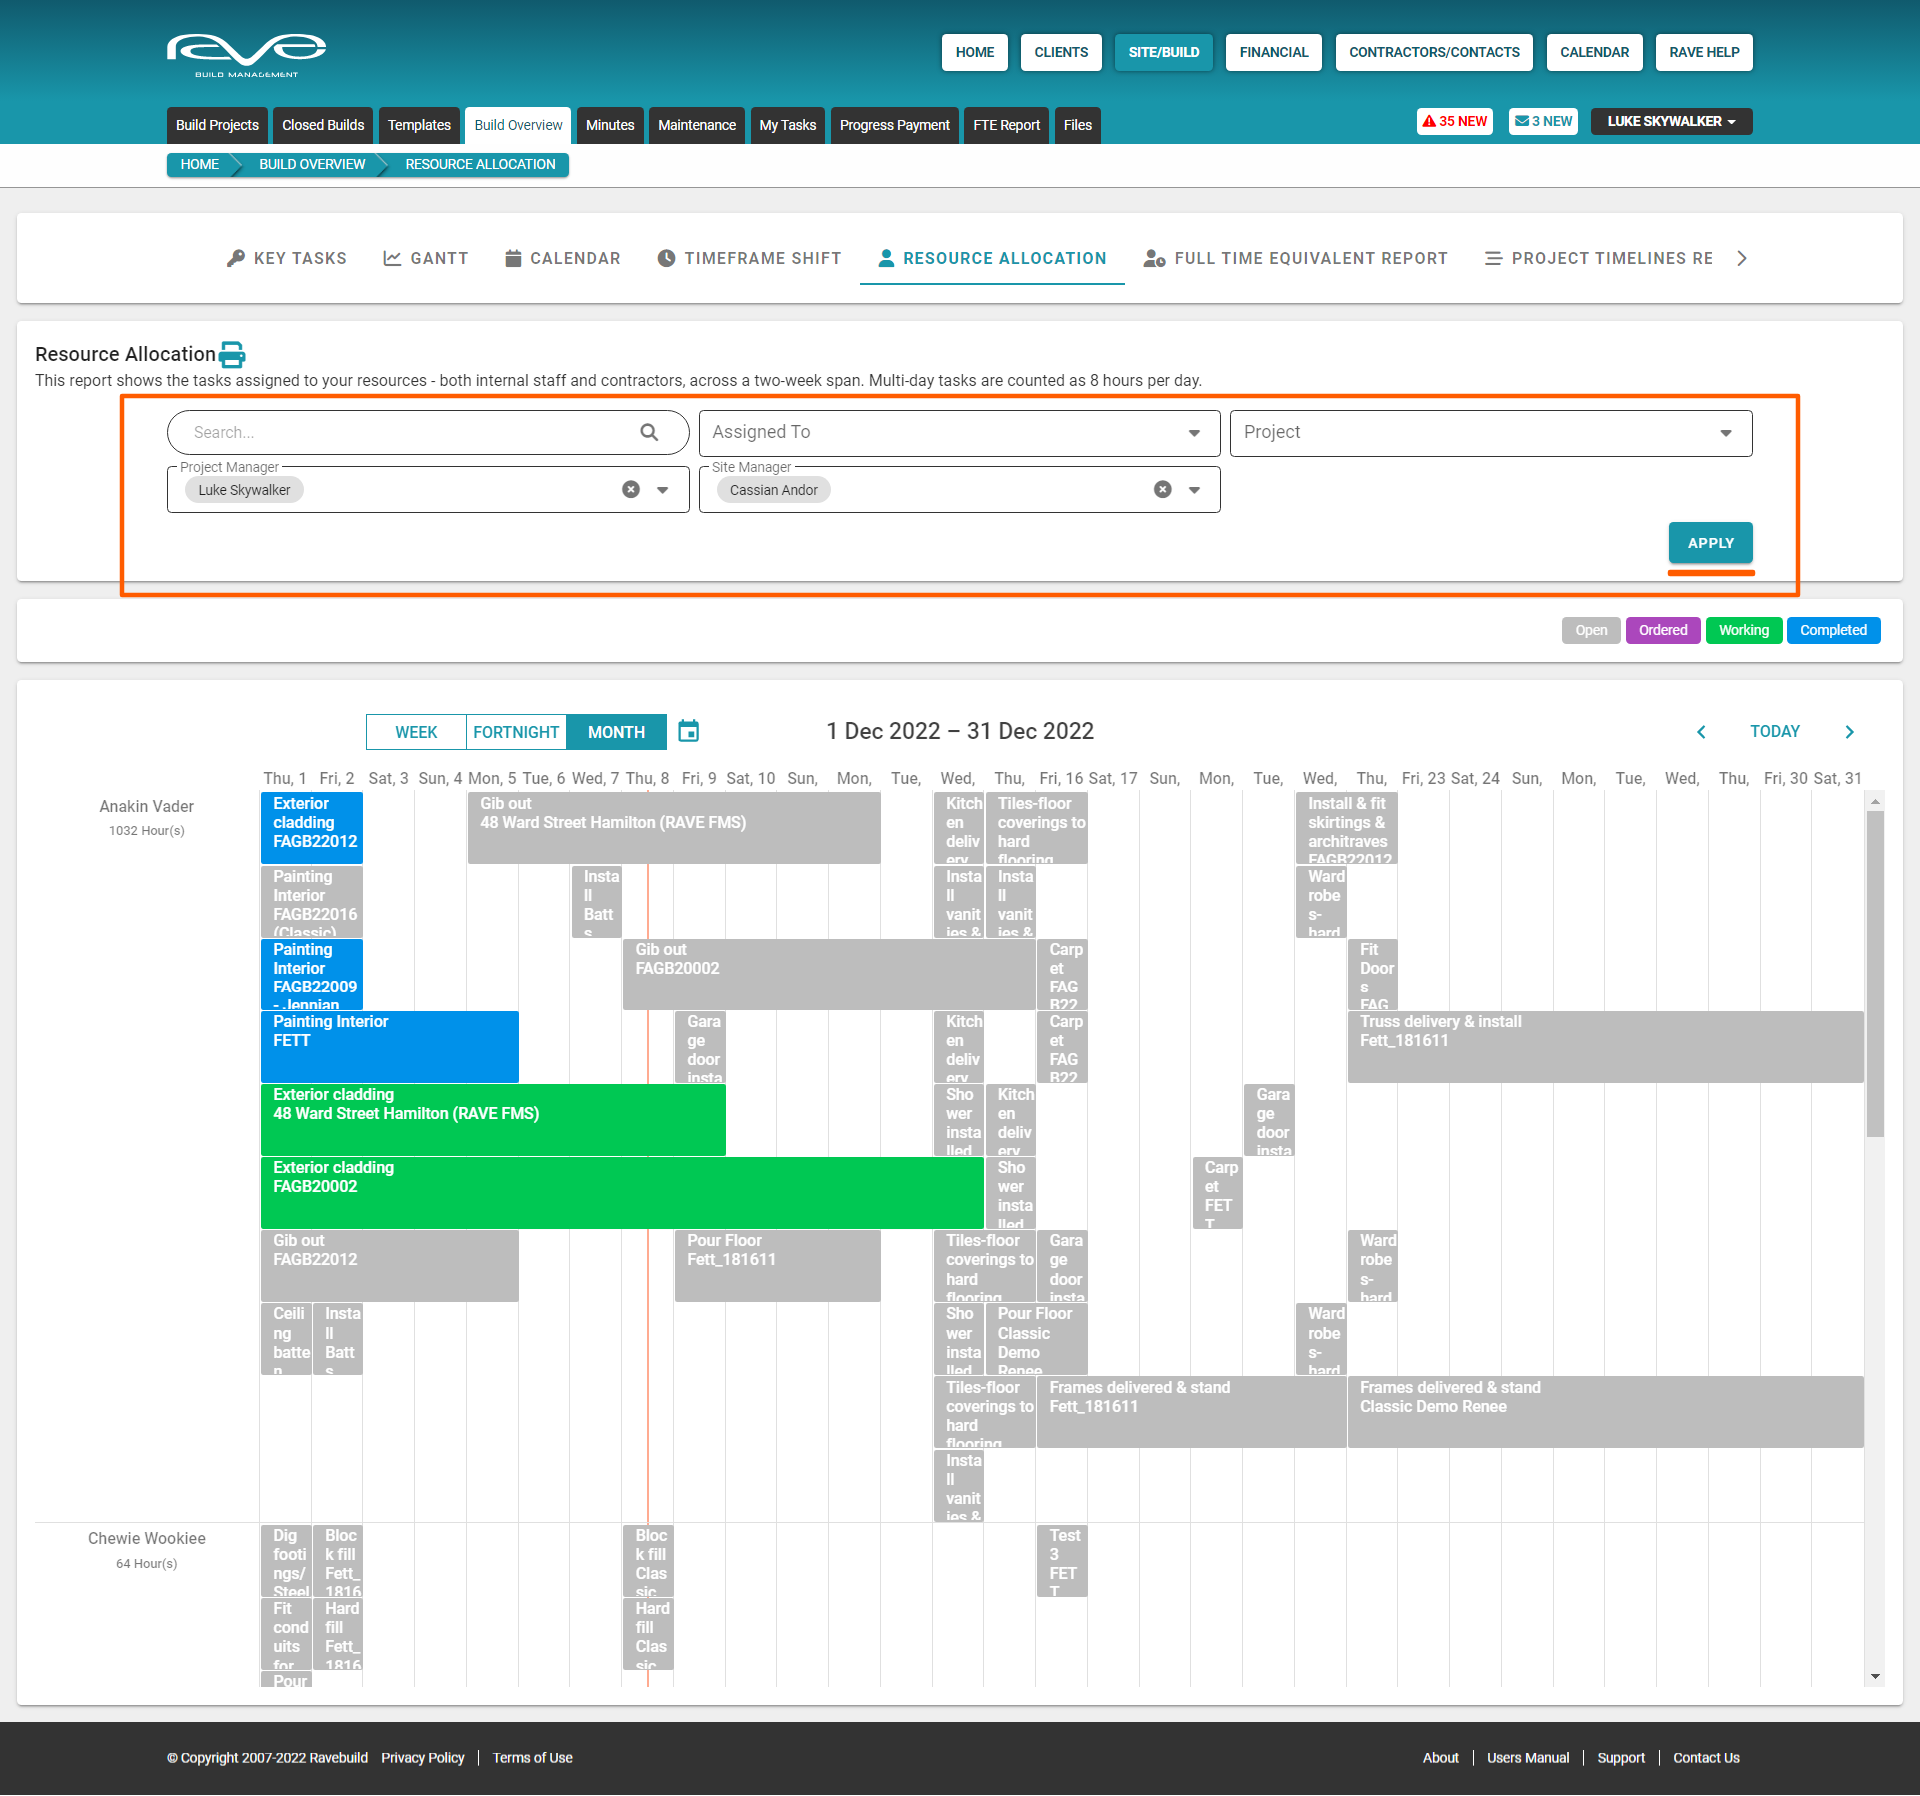
Running a Resource Allocation Build Overview Report using the Build Overview Filters
At the top of the ‘Resource Allocation’ build overview page, are a number of reporting filter options – these are available for most of the Build Overview reports, and allow you to create your own customised reports – these are:
- The Search field – allows you to search/filter tasks by their Task Description
- Assigned To – allows you to view tasks assigned to specific task assignee(s)
- Project – allows you to view tasks across a selection of specific jobs
- Project Manager – project managers can view just their projects, a selection of project managers projects, or ALL projects
- Site Managers – allows you to view jobs managed by specific Site Manager(s)
Once you have set your filter options, click ‘Apply’ at the bottom right of the filters, to apply your selections to the report.
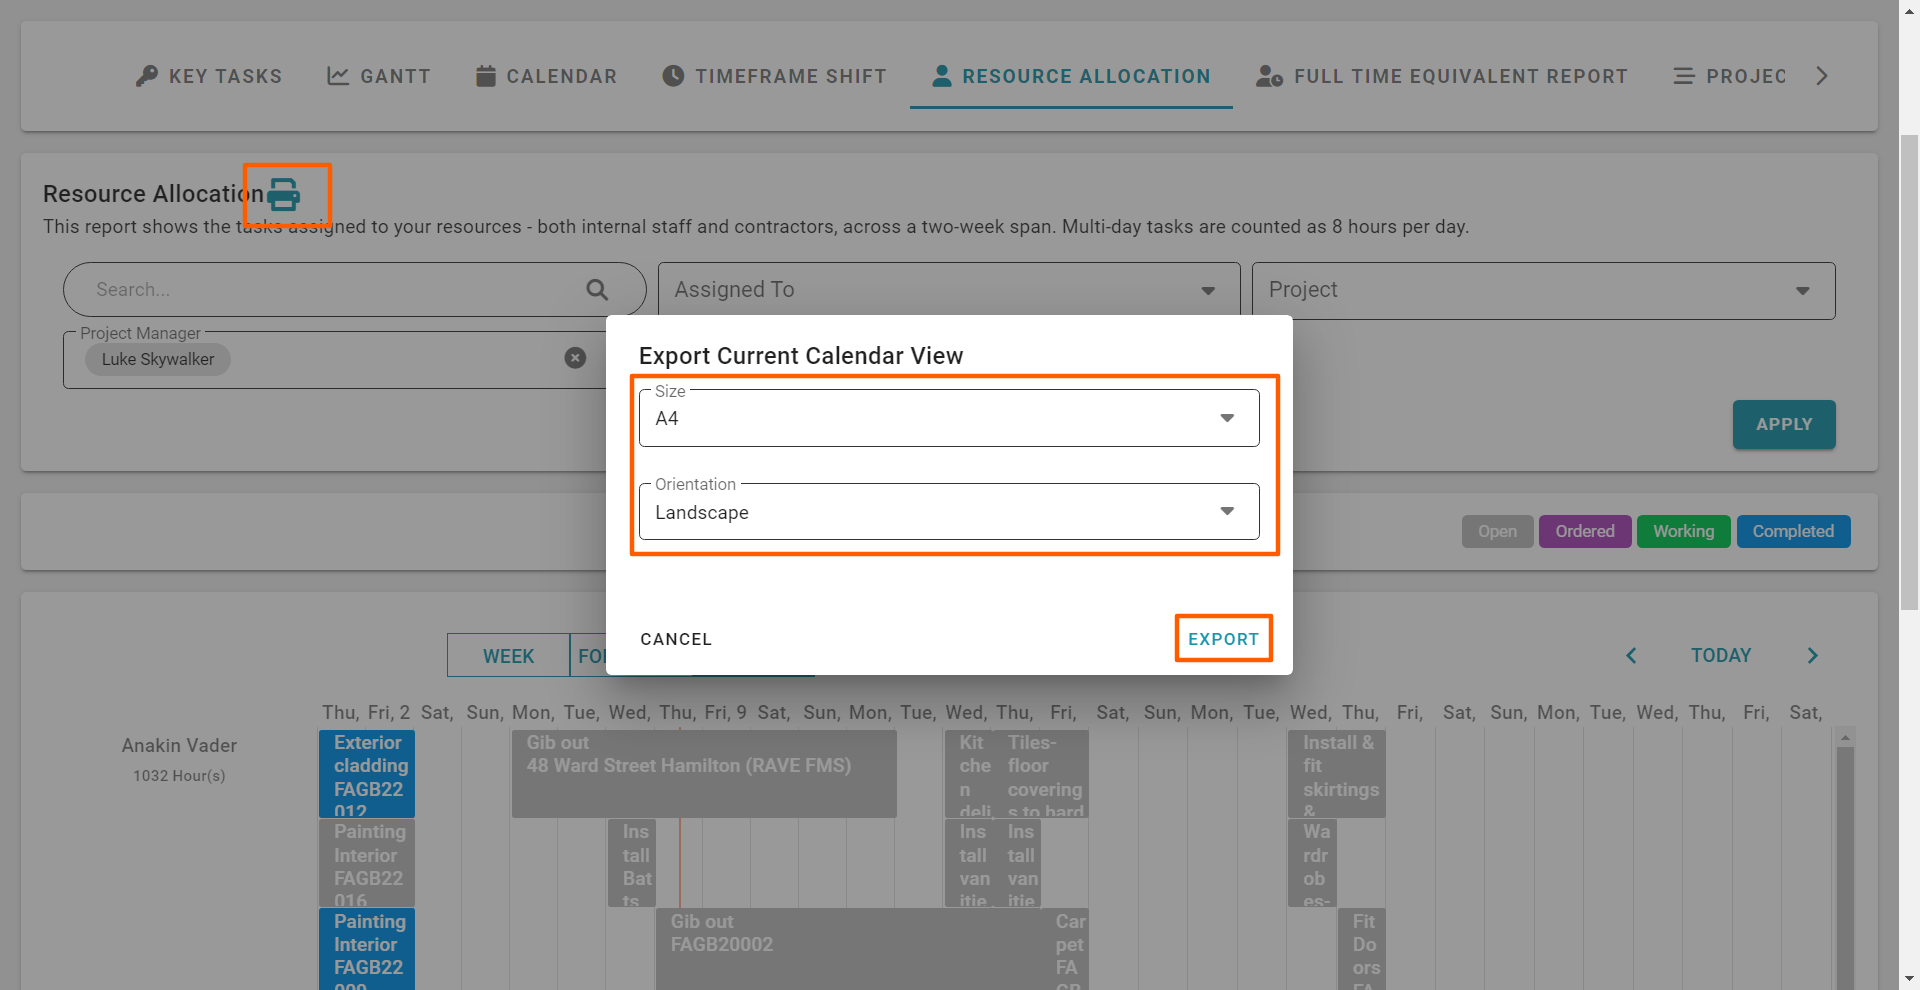
Printing your Resource Allocation report
Once you have applied your filters, you have the ability to export your Resource Allocation report for printing. This is via the printer icon to the right of the job number – above and to the left of the Resource Allocation filters.
To print your Resource Allocation report:
- Click the printer icon (to the right of you job number) – this will open the ‘Export Current Resource Allocation View’ pop-up
- From here you just select
- The size of paper you are going to print to i.e. A4, A3, A2 etc
- The orientation of the print out i.e. Landscape or Portrait
- And then click ‘Export’ to print – this will open a new tab previewing your Resource Allocation report
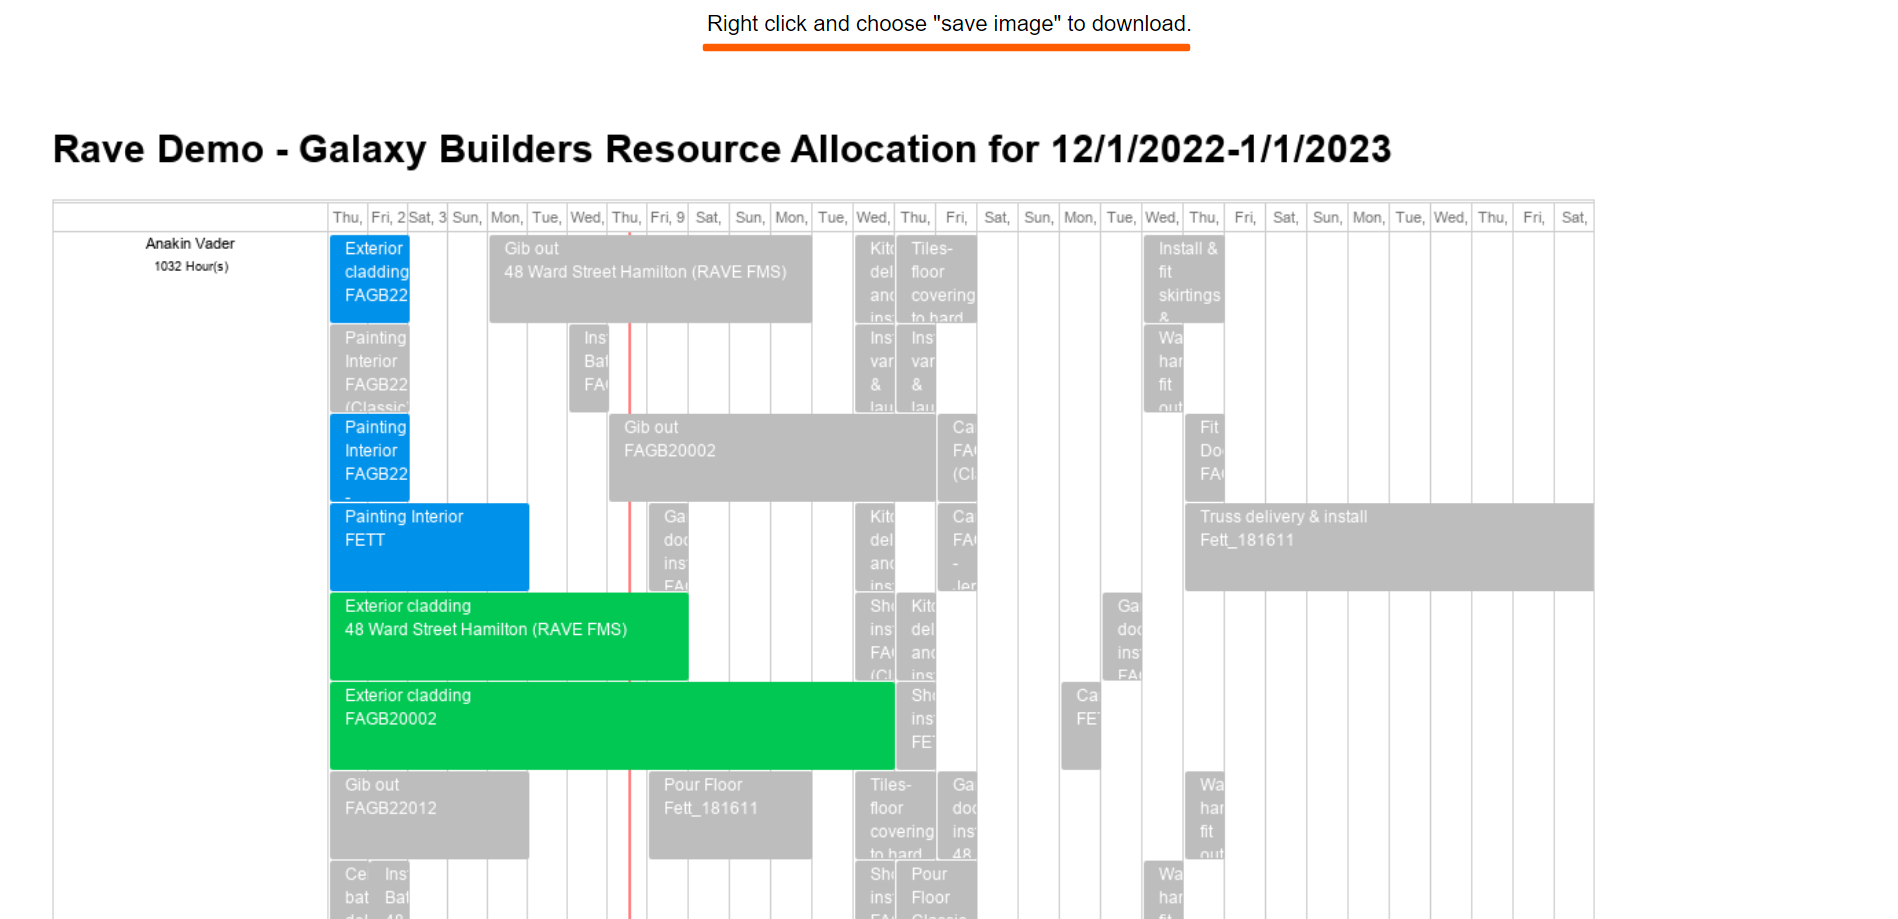
- From here we ‘right click’ on the web page, and select ‘Save Image As’
- This will open your file browser pop-up giving you the chance to save this as a picture file and where to save it to
- Click ‘Save’ to save it
- Then open your saved image file of the Resource Allocation report, and click on your printer icon to print it.
From here you will be able to print to whatever paper size, and scale you want i.e. fit to a page, or your own scale option. If your printer supports 'poster' or 'tile’ printing, you can blow the Gantt chart image file up over 2 or more pages (x pages wide by y pages high), allowing you to print an enlarged version of your gantt charts without the need for a larger printer.
---
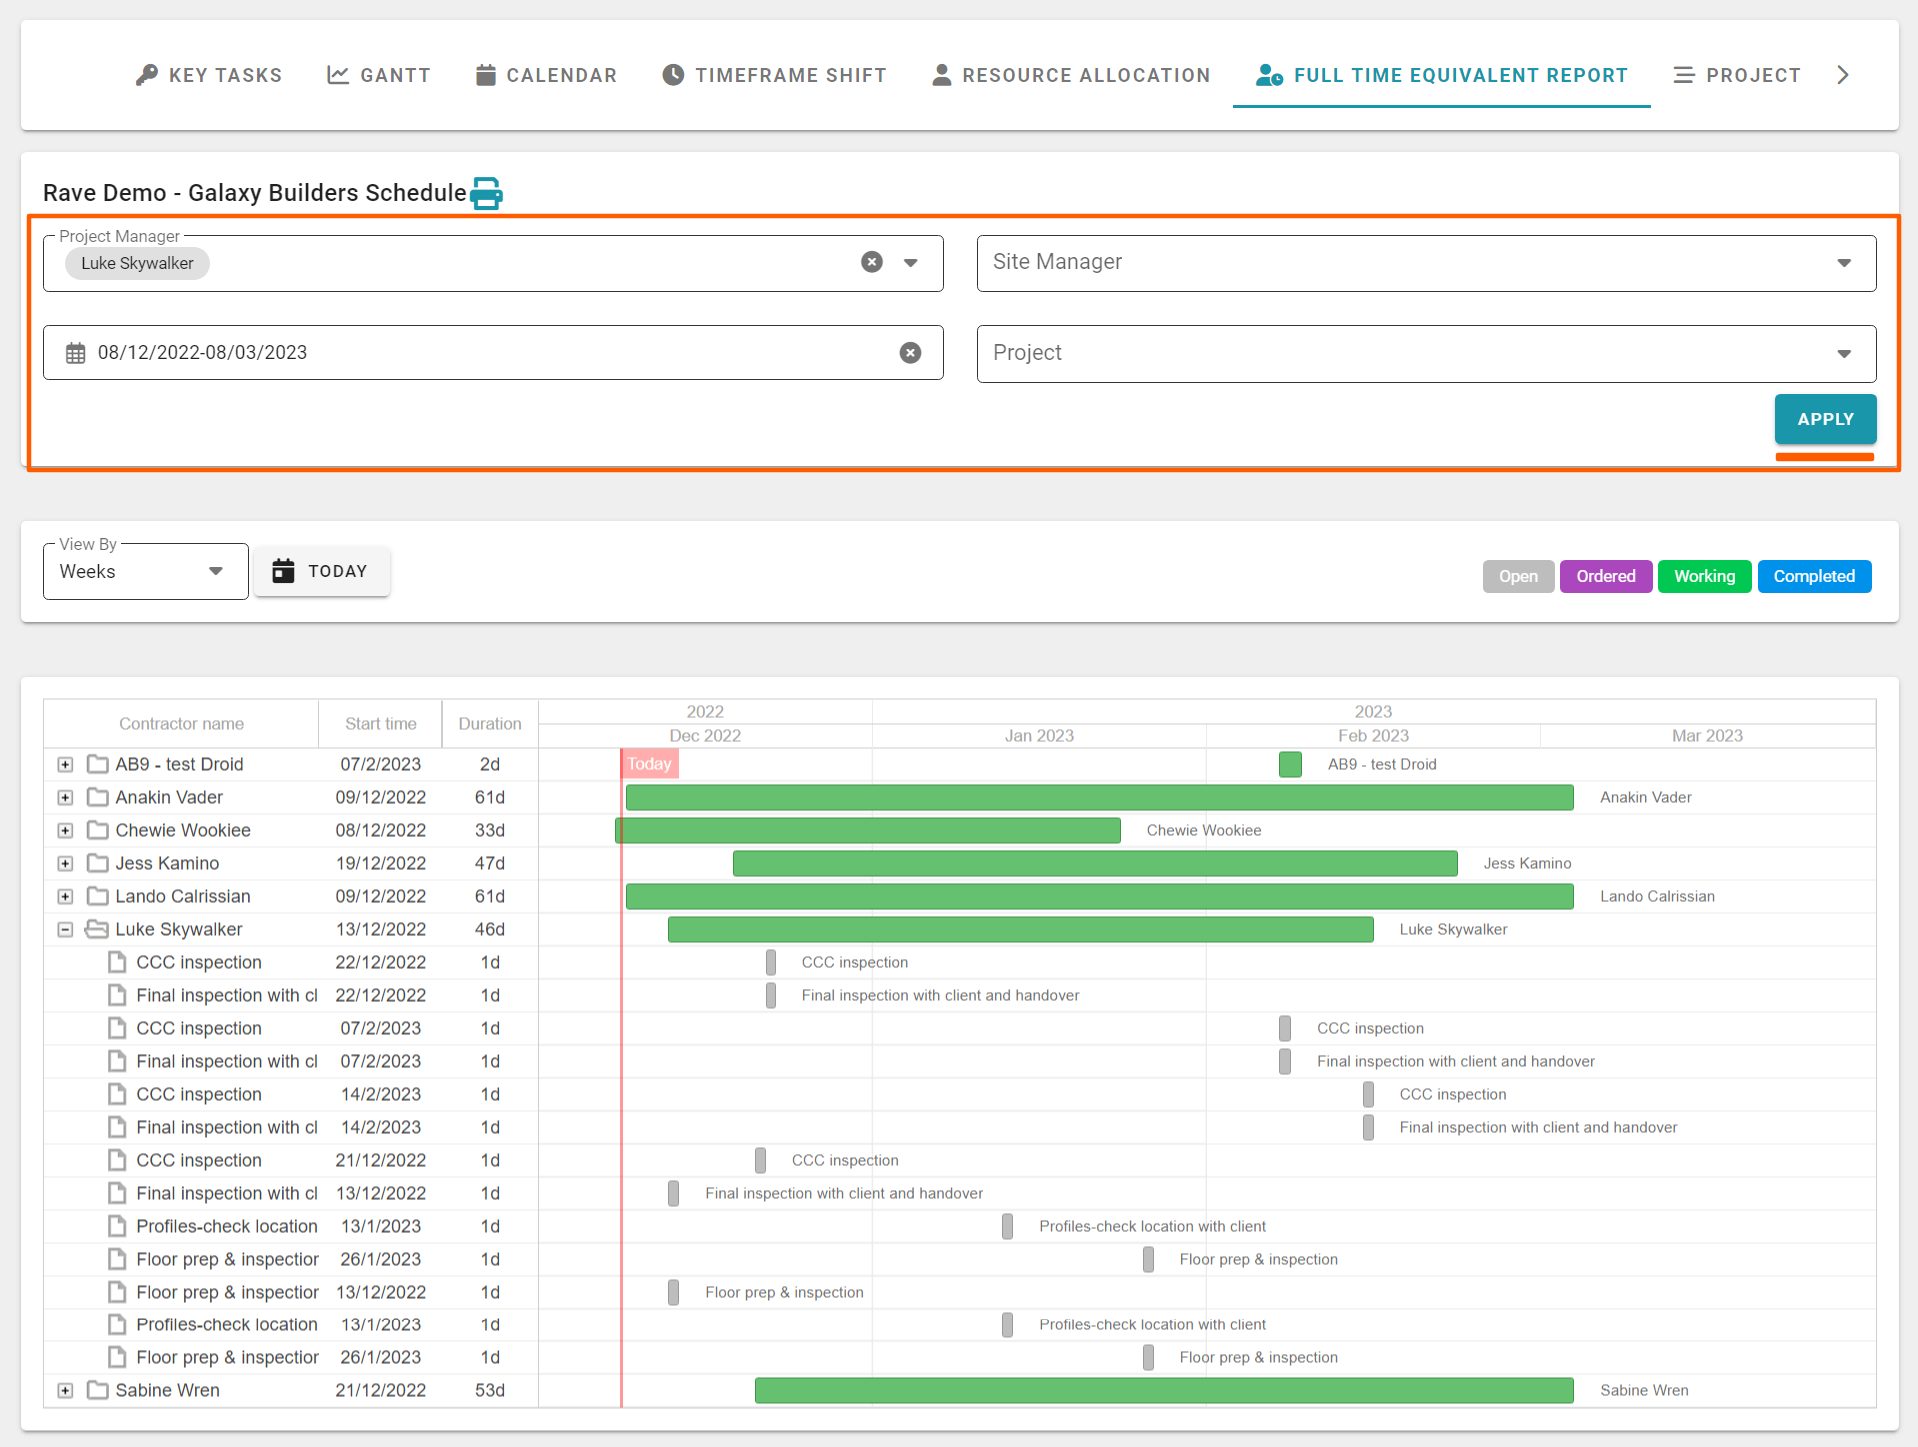
The Full-Time Equivalent (FTE) Build Overview Report
The next report is the Full-Time Equivalent Report - available via Site|Build / Build Overview / Full-Time Equivalent Report. It’s similar to the Resource Allocation report but allows for a customised timeframe and a more condensed layout. This report also relies on your tasks being assigned out to staff and contractors – and once done, allows you to see task progress, and how busy your team and trades are via a month, fortnight, or week view.
As you can see, this report displays:
- Your Staff Members and Trades in first name alphabetical order with a summary of the start date and duration for a given block of work – displayed in green on the chart to the right
- Clicking on the plus to the left of a person's name will expand their specific tasks, each displaying
- The task description
- Start date and duration
- The expanded chart to right displays the individual tasks across their date range columns – each task displaying it’s
- Task description
- Hovering over a task will pop up a display of it's:
- Job number
- Task description
- Start and Finish dates
- Each task block is clickable – taking you to the Task List view of that project for quick editing
- This report includes today’s date line (assuming today’s date falls into the range of the report), allowing you to instantly view tasks falling behind – via our gantt colour coding (displayed to the top right) i.e. any tasks in an open (grey) or ordered (purple) state to the left of the dateline may be something for the project manager to chase up.
- To the top left, we have the ‘View By’ selector allowing you to zoom in/out by day, week, fortnight, month and year.
- And the ‘Today’ button, which snaps the gantt chart back so the dateline is positioned on screen

Running a Full-Time Equivalent (FTE) Build Overview Report using the Build Overview Filters
At the top of the ‘Full-Time Equivalent Report’ page, are a number of reporting filter options – these are available for most of the Build Overview reports, and allow you to create your own customised reports – these are:
- Project Manager – project managers can view just their projects, a selection of project managers projects, or ALL projects
- Site Managers – allows you to view jobs managed by specific Site Manager(s)
- Date Range – allows you to view tasks due in a specific date range
- Project – allows you to view tasks across a selection of specific jobs
Once you have set your filter options, click ‘Apply’ to the bottom right of the filters, to apply your selections to the report.
Printing (and Exporting) Full-Time Equivalent (FTE) Report
Once you have applied your filters, you have the ability to export your Full-Time Equivalent (FTE) report for printing. This is via the printer icon to the right of the job number – above the FTE Report filters, to the left.
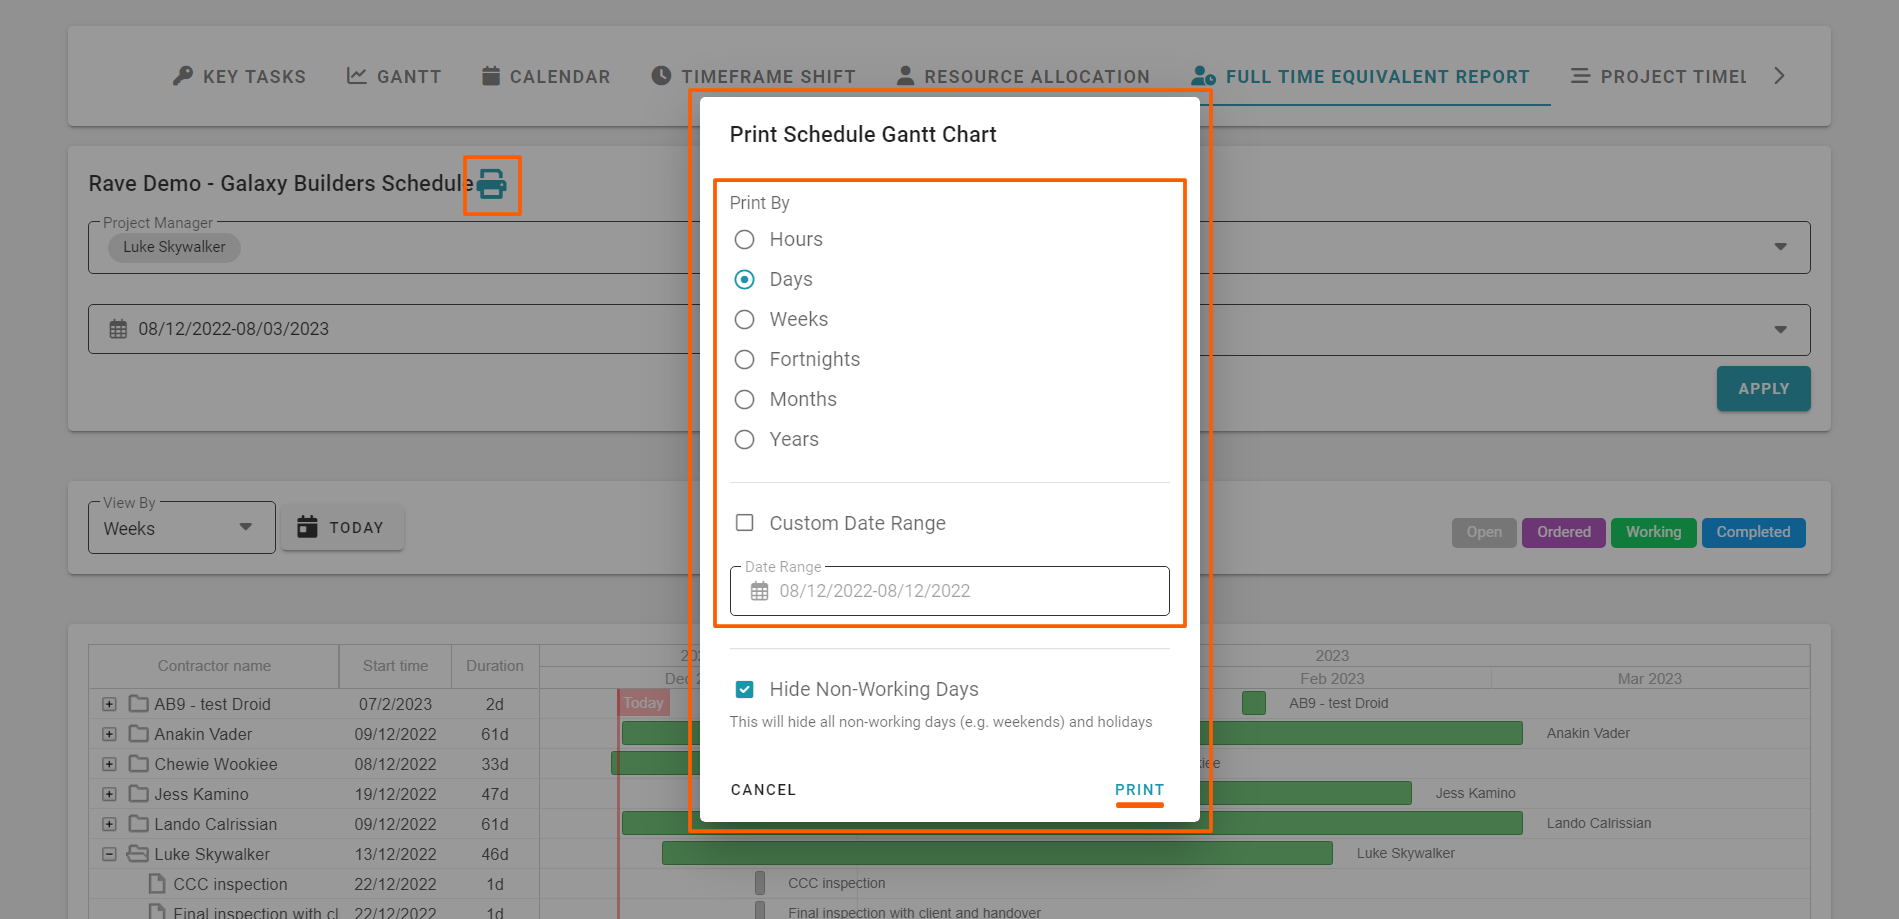
To print your Full-Time Equivalent (FTE) Report:
- Click the printer icon (to the right of your job number) – this will open the ‘Print Schedule Gantt Chart’ pop-up
- From here you just select
- The ‘print by’ scale setting you want your printout to display as
- Select the start and finish dates of the range you want to display
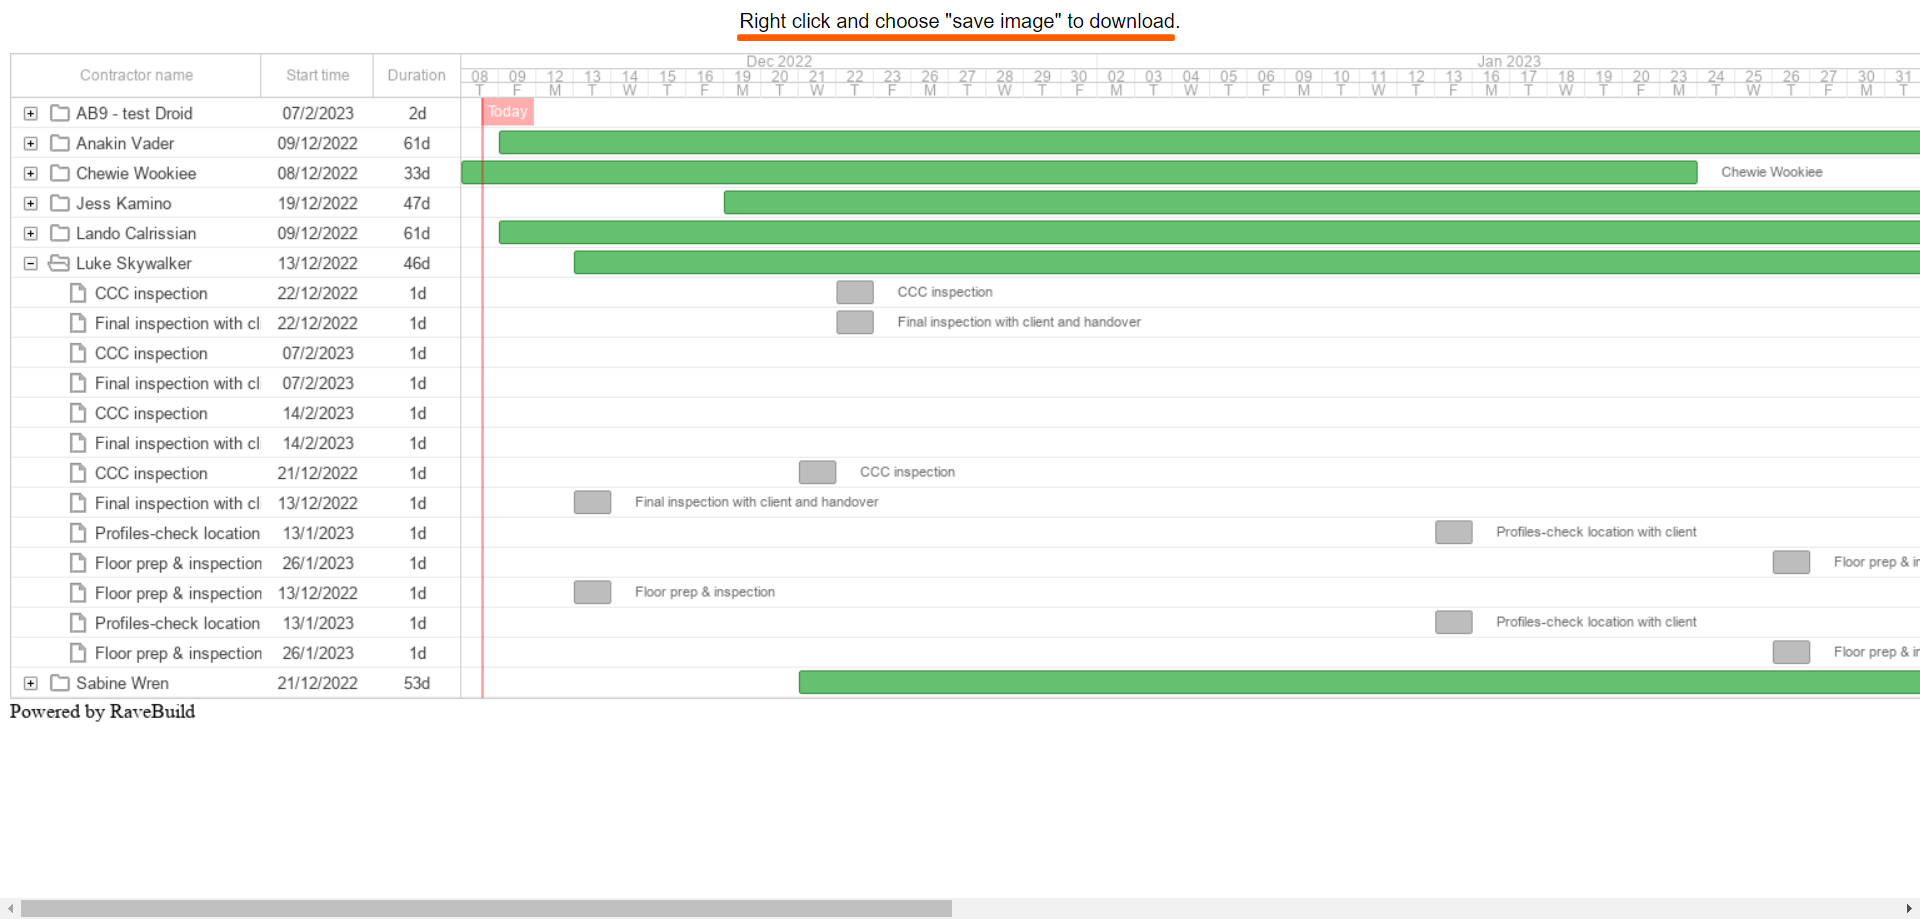
- And then click ‘Print’ – this will open a new web page tab previewing the FTE report
- From here we ‘right click’ on the web page, and select ‘Save Image As’
- This will open your file browser pop-up giving you the chance to save this as a picture file and where to save it to
- Click ‘Save’ to save it
- Then open your saved image file of the FTE report, and click on your printer icon to print it.
From here you will be able to print to whatever paper size, and scale you want i.e. fit to a page, or your own scale option. If your printer supports 'poster' or 'tile’ printing, you can blow the Gantt chart image file up over 2 or more pages (x pages wide by y pages high), allowing you to print an enlarged version of your gantt charts without the need for a larger printer.
---
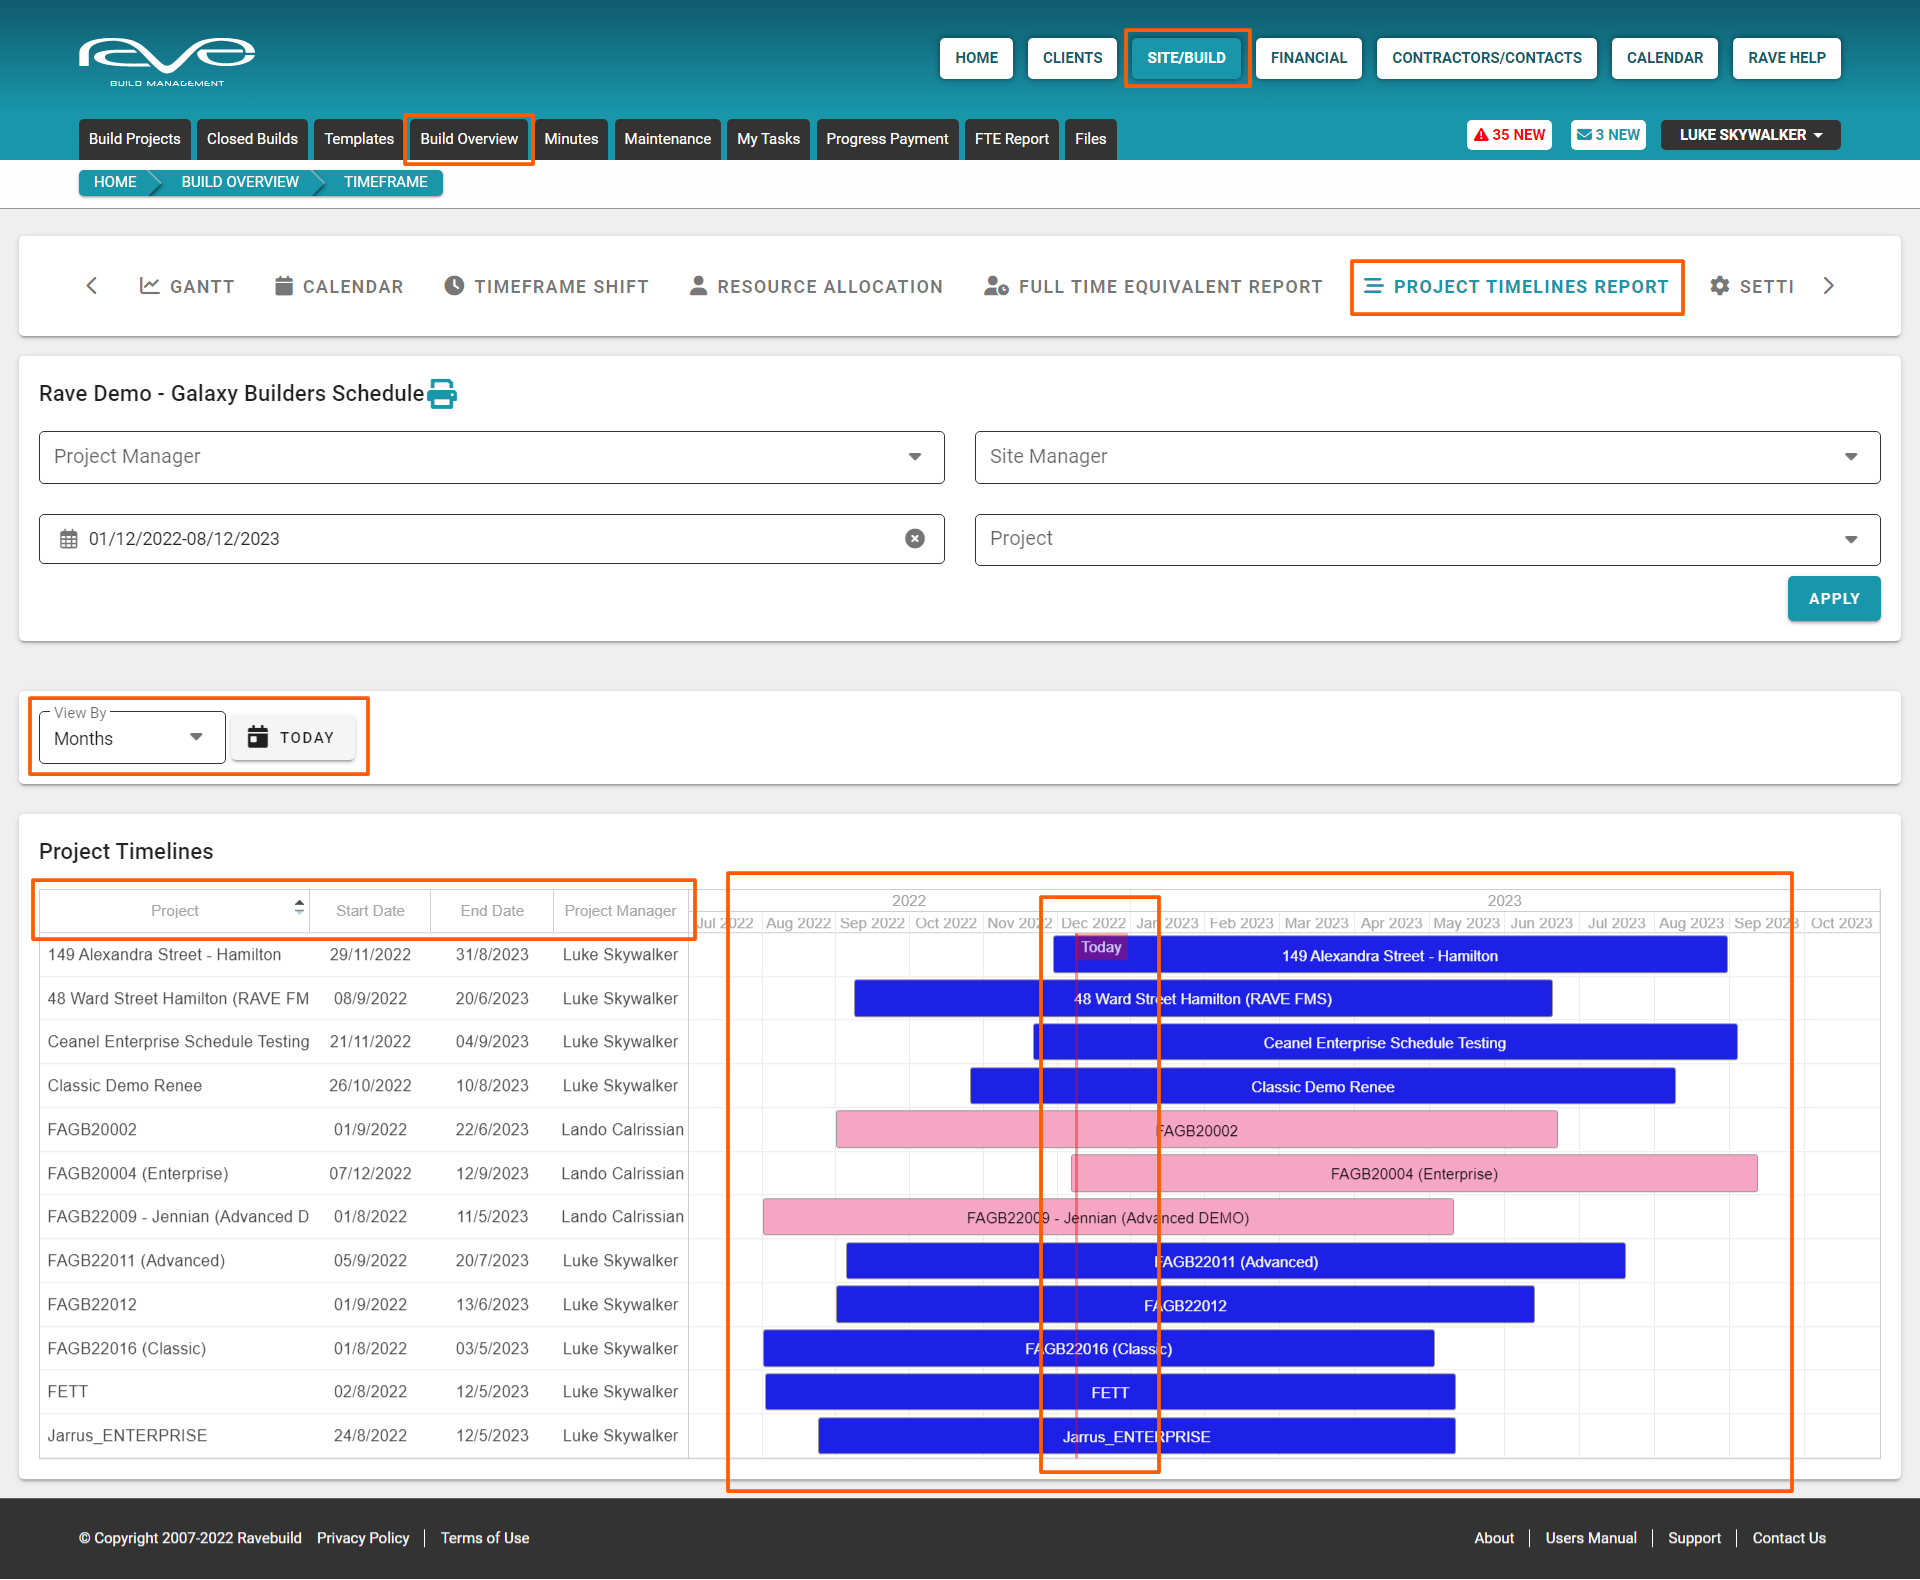
The Project Timelines Build Overview Report
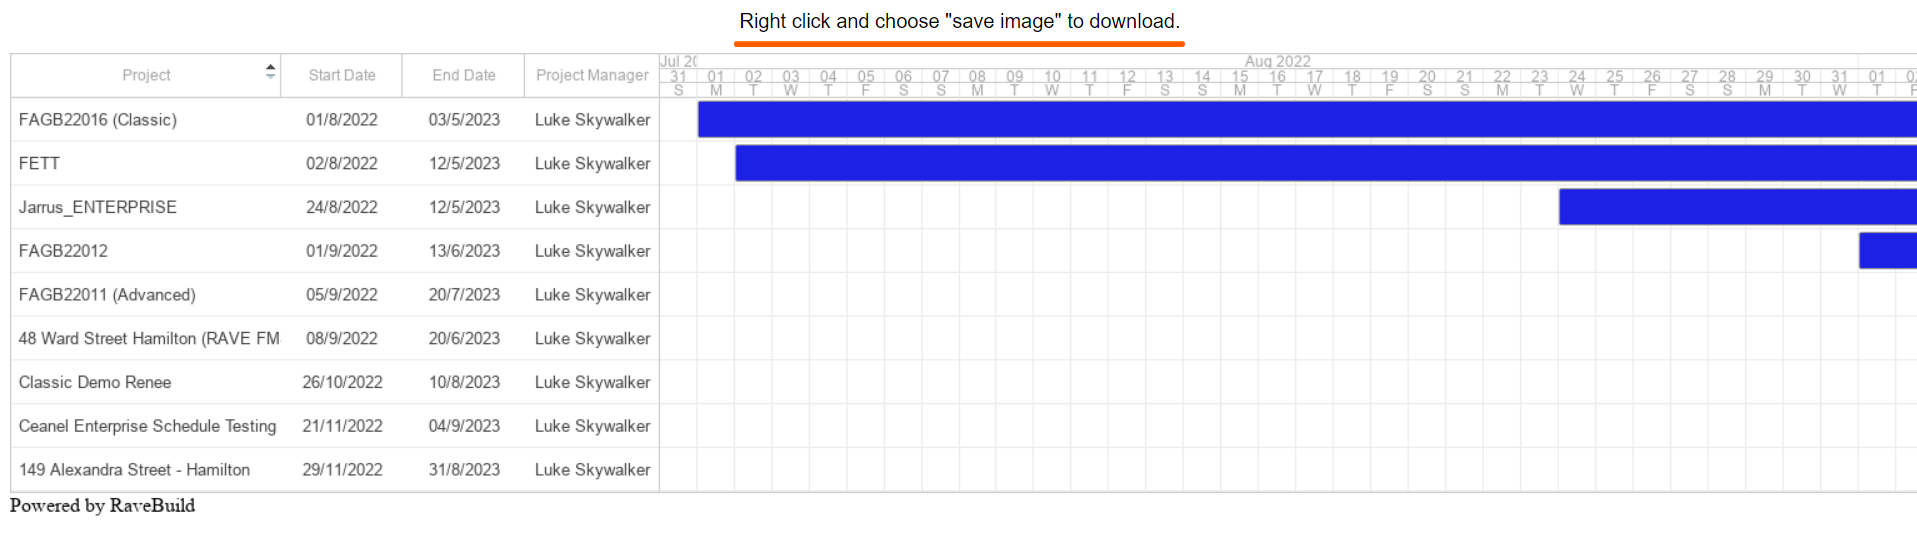
Our final cross-project report is the Project Timelines Report - available via Site|Build / Build Overview / Project Timelines Report. This provides a very top-level view of when your projects are due to start and finish, with handy colour coding by the project manager - prompting you to think about your current and future workload, and also helping you to identify when you need to start slotting in your next lot of work.
Again we have a number of super handy filter options, plus the ability to export your Project Timelines Report for printing – we’ll show you how to do this shortly.
The Project Timelines Report is pretty straightforward:
- We list your project number + contract name
- The start date of your first task in each schedule
- The finish date of your last task in each schedule
- And the project manager's name
- the column headers are clickable, allowing you to sort by these
- the data in the columns are clickable – taking you to the Milestone view of that project - We have the chart display to right, visually showing:
- the start and finish of your schedule
- the project number + contract name
- and each project manager is colour coded – allowing you quickly and easily identify which project is being managed by which project manager.
- today’s date line, allows you to instantly view how far through your project timelines you are
- To the top left, we have the ‘View By’ selector allowing you to zoom in/out by day, week, fortnight, month, and year.
- And the ‘Today’ button, which snaps the gantt chart back so the dateline is positioned at the centre of the gantt.
Running a Project Timelines Report using the Build Overview Filters
At the top of the ‘Project Timelines Report’ build overview page, are a number of reporting filter options – these are available for most of the Build Overview reports, and allow you to create your own customised reports – these are:
- Project Manager – project managers can view ALL projects or just their own projects
- Site Managers – allow project managers to view jobs run by a specific Site Manager(s)
- Date Range – filter the chart display to a specific date range period
- Project – allow project managers to view the chart across a selection of specific jobs
Once you have set your filter options, click ‘Apply’ at the bottom right of the filters, to apply your selections to the report.

Printing your Project Timelines Report
Once you have applied your filters, you have the ability to export your Project Timelines Report for printing. This is via the printer icon to the right of the job number – above the Project Timelines Report filters, to the left.
To print your Project Timelines Report:
- Click the printer icon (to the right of your job number) – this will open the ‘Print Schedule Gantt Chart’ pop-up
- From here you just select
- The ‘view by’ scale setting you want your print out to display as
- Select the start and finish dates of the range you want to display
- And then click ‘Print’ to print – this will open a new tab previewing your Project Timelines Report view
- From here we ‘right click’ on the web page, and select ‘Save Image As’
- This will open your file browser pop-up giving you the chance to save this as a picture file and where to save it to
- Click ‘Save’ to save it
- Then open your saved image file of the Project Timelines Report report, and click on your printer icon to print it.
From here you will be able to print to whatever paper size, and scale you want i.e. fit to a page, or your own scale option. If your printer supports 'poster' or 'tile’ printing, you can blow the Gantt chart image file up over 2 or more pages (x pages wide by y pages high), allowing you to print an enlarged version of your gantt charts without the need for a larger printer.