If your RAVE system has the optional Financial Management System module activated and you have the correct permissions, you’ll find the Project Charge Up Report by selecting the project, then clicking Budget, then hovering over the Project Reporting subtab and clicking Charge Up Report.
The following is the recorded version of the help article outlined below.
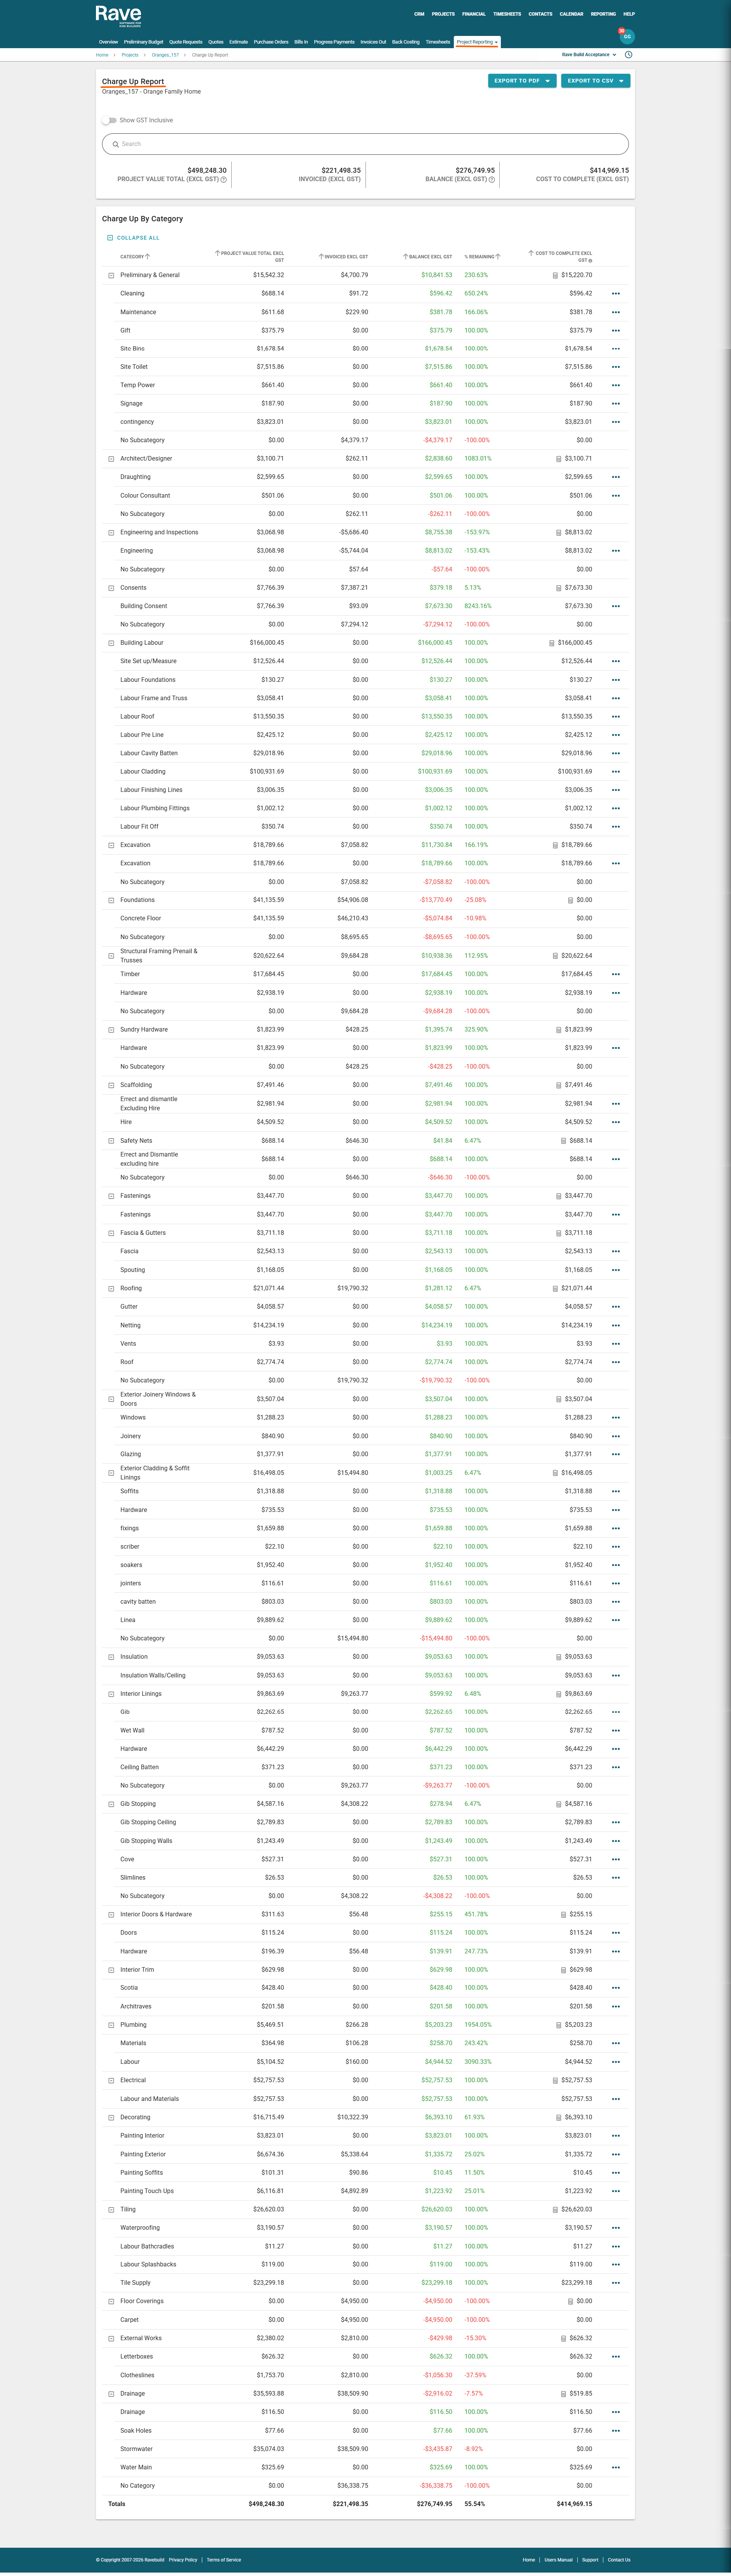
Your project's Charge Up report displays your project's 'Estimate Total' vs what has been 'Invoiced' to date, the 'Balance' still to be invoiced (including any variations) and the 'Cost to Complete'.
An expanded view by category and subcategory is also available, so you can easily view and compare the categories and subcategories in estimate total vs what has been invoiced out and is still to be invoiced.
A handy 'Show GST Inclusive' switch allows you to alter all figures to include GST. You also have the ability to export your report to PDF or a CSV file.
How to Use RAVE's 'Charge Up' Report
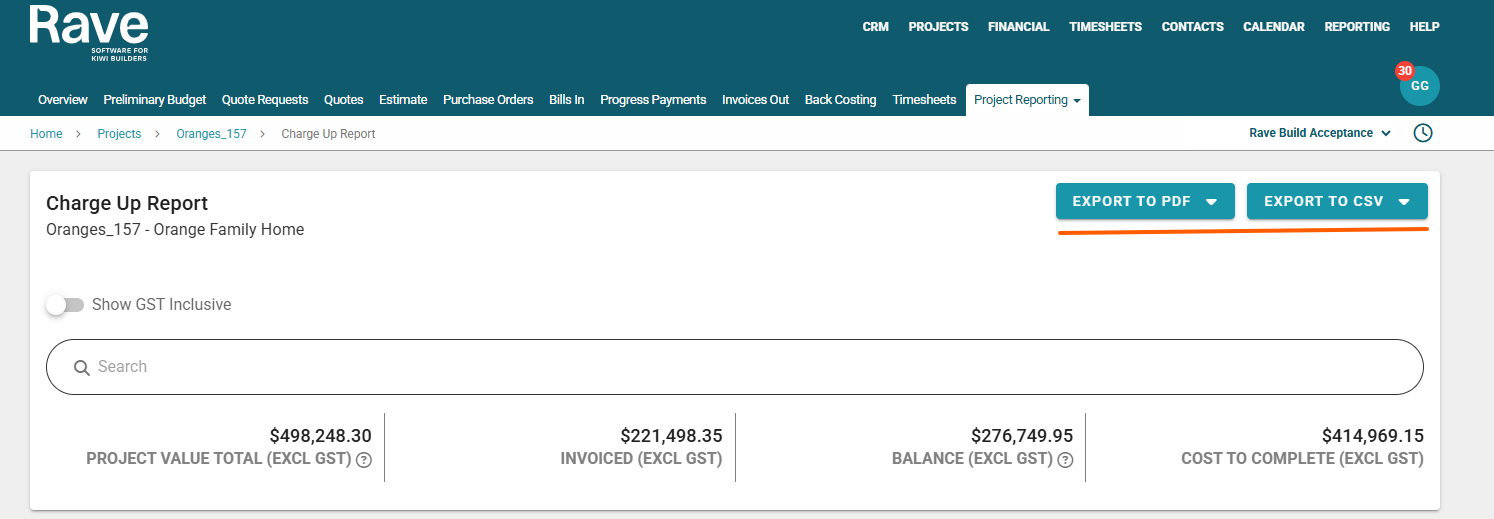
To the top of the screen, you have the charge up report's summary table displaying the:
- Estimate Total - the current total of what is to be billed to the client
- Invoiced - the current total of what has already been invoiced to the client
- Balance - the current total of what is still to be invoiced to the client
- Cost to Complete - the balance required to “complete” this project based on the approved Invoices Less Client Estimate.
These figures exclude GST by default and include variations (if any) A handy 'Show GST Inclusive' switch allows you to change all dollar values on the page to include GST.
Setting the Cost to Complete
The Cost to Complete column (located on the right-hand side of the report) shows the remaining cost required to finish the project. It calculates this by taking all of your Client Invoices, vs your Approved Estimate total including variations and then providing the balance needed to complete the project.
You can manually adjust this figure if needed:
To manually adjust the Cost to Complete to any value equal to or lower than the current amount, click the 3-dot ellipsis and select Set Cost to Complete. You can then type in your desired value. Please note you cannot set a value higher than the system-calculated total—only equal to or less than it.
To set the Cost to Complete to zero, click the 3-dot ellipsis and select Zero Cost to Complete. This will recalculate the Cost to Complete total to $0, and the total at the bottom of the report will update automatically.
To restore the Cost to Complete back to its actual calculated figure, click the same button again and select Recalculate Cost to Complete.
If you’re using Sub-Categories, you’ll need to expand them and set the Cost to Complete for each Sub-Category individually. The system will then automatically recalculate the total for the main Category.
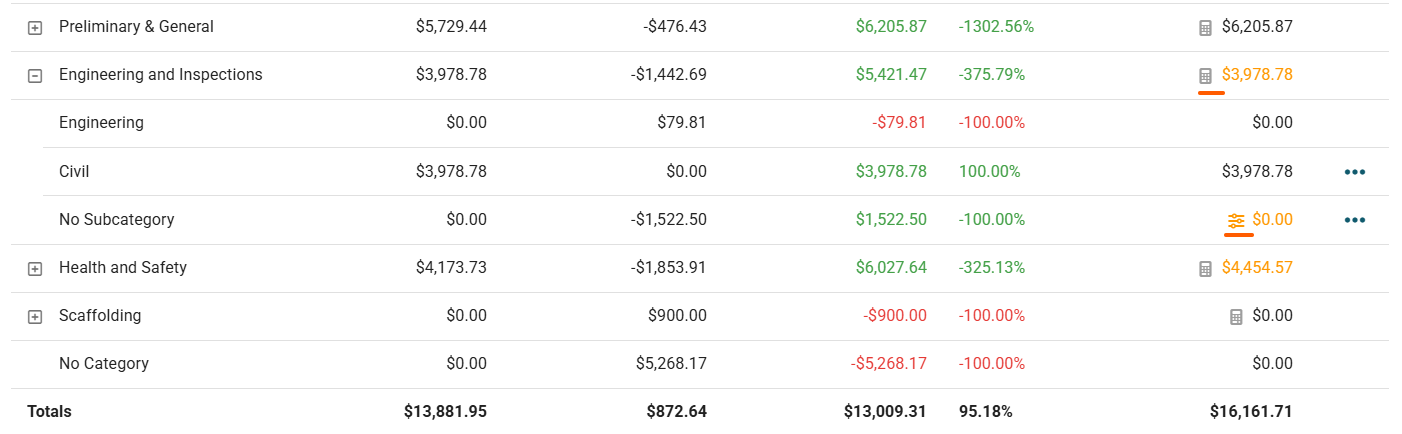
Icons and their meaning
The calculator icon indicates that the value beside it is the sum of all Sub-Category Cost to Completes. This total cannot be edited directly— it can only be updated by changing the Cost to Complete values within each Sub-Category.
The slider icon indicates that the Cost to Complete has been set manually, meaning it is not auto calculated and is not set to zero.
The charge up report then splits these totals out by category - displaying each categories estimate total, invoiced total, balance still to be invoiced with the % of budget remaining, and the cost to complete figure. This allows you to quickly check what you have and haven't charged your clients yet.
The balance column displays its category line data in 3 colours:
- Green - there is still an amount to charge your client
- Black - there is nothing left to charge your client
- Red - indicates an overspend
Down the bottom of the report is a column's total row - these total figures match the summary table to the top right.
At any point, you can export your charge up report to PDF or a CSV file. Both options allow you to choose if you would like to print just the Categories or with the Subcategories as well.
NOTE: Whether you are converting your invoiceables to invoices, or are using the traditional charge up method of converting all of your supplier bills to client invoices - whenever you create your client invoices, you need to ensure that the line items have their categories attached - so that the charge up report provides you with better reporting data.
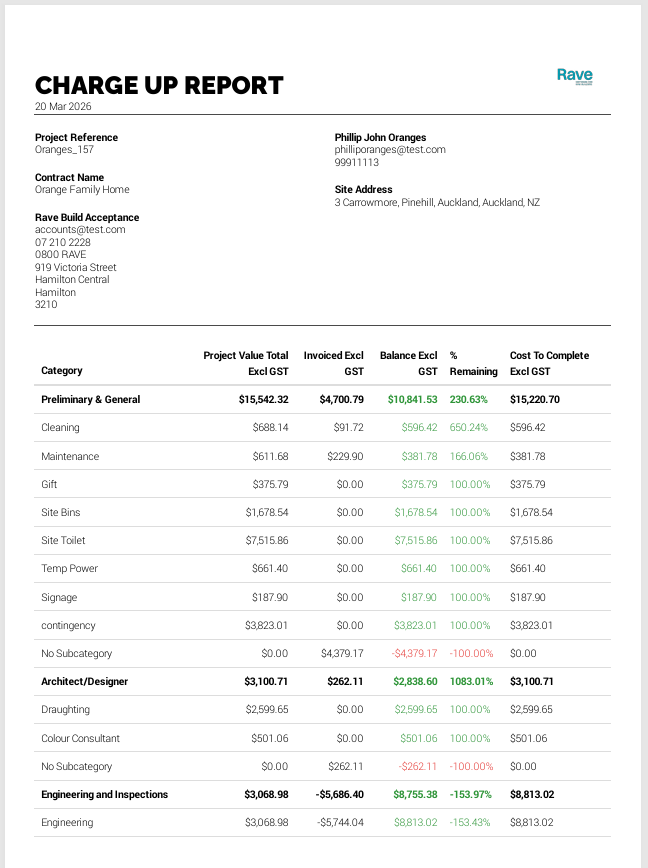
Below - the first page of a Charge Up Report exported as a PDF
Was this article helpful?
That’s Great!
Thank you for your feedback
Sorry! We couldn't be helpful
Thank you for your feedback
Feedback sent
We appreciate your effort and will try to fix the article